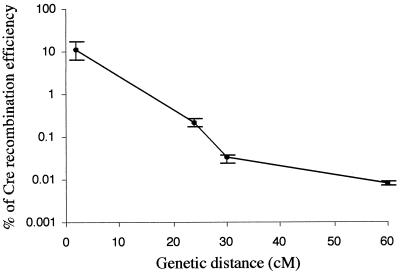
FIG. 5.
Efficiency of Cre recombination over genetic distance. The percentage of Cre recombination efficiency (y axis, in log10 scale) is plotted against the genetic distance (x axis, in linear scale). The first datum point represents a deletion. The other three points with larger genetic distances represent inversions. Error bars indicate the standard deviations. The numbers of independent experiments were as indicated in Table 1.

