Figure 7.
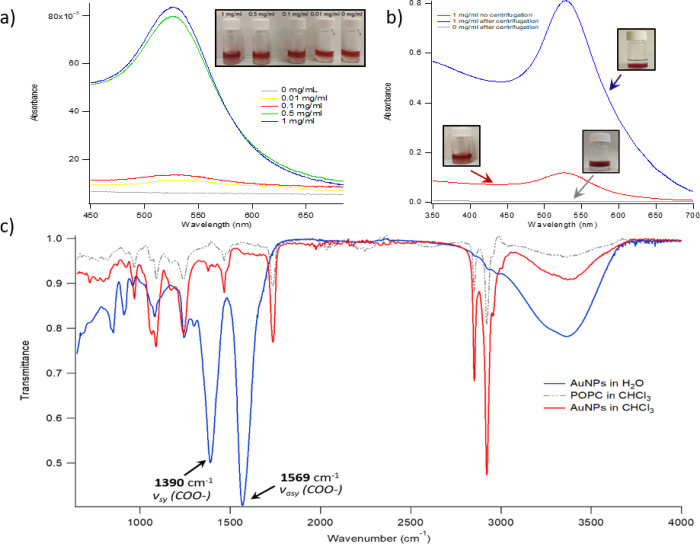
(a) UV–vis absorbance of the CHCl3 phase (after 1 h incubation with water-dispersed Au NPs) for different initial POPC concentrations (0, 0.01, 0.10, 0.50, and 1 mg/mL); inset: visual appearance of the corresponding samples; (b) UV–vis absorbance of the CHCl3 phase (1 mg/mL in POPC and 1 h contact with water-dispersed Au NPs) for centrifuged and noncentrifuged samples, and visual appearance of the corresponding samples; (c) ATR-FTIR spectra of CNPs recovered from a water dispersion, POPC, and AuNPs recovered from CHCl3 after extraction from the aqueous phase. The characteristic citrate features of the spectra of CNPs, that is, the νsy(COO−) and νasy(COO−) vibrations (arrowed), disappear when Au NPs are recovered from CHCl3 after extraction. The signals not originally present for CNPs are consistent with POPC (see the gray dashed spectrum of pure POPC for comparison).

