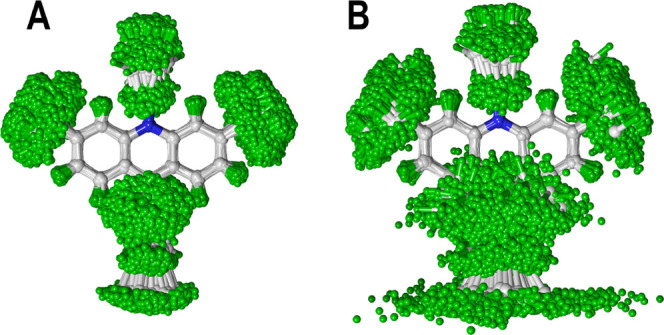
Figure 3.

Comparison of the quantized nuclear distributions for Acr: (A) 806 superimposed nuclear configurations obtained from GSTA correction; (B) 1000 superimposed nuclear configurations obtained from the Wigner sampling at 298.15 K. Color code: hydrogen, green; nitrogen, blue; carbon, gray.
