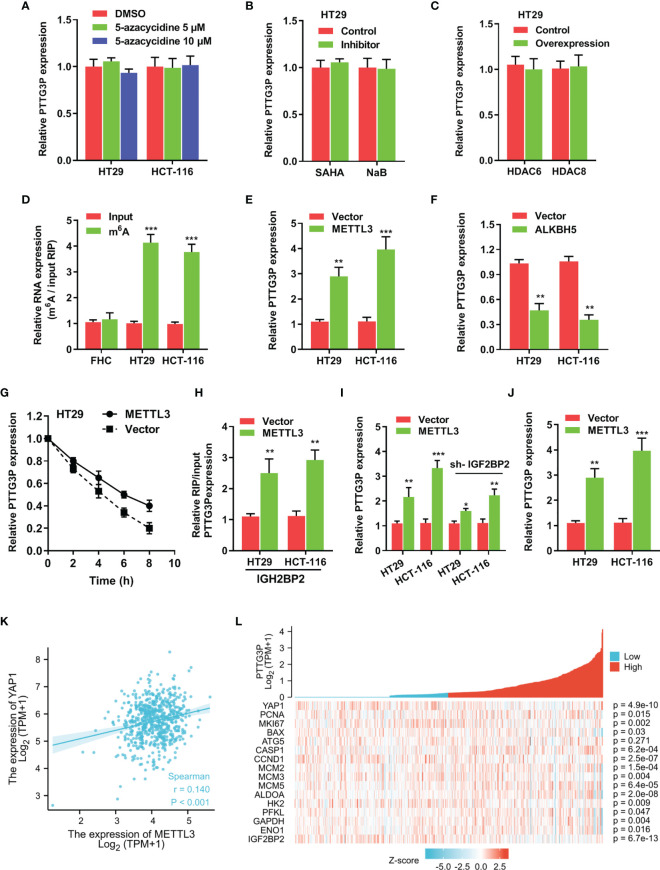
Figure 5.
m6A modification is involved in the ectopic expression of PTTG3P in CRC (A) qRT-PCR analysis of PTTG3P treated with DMSO or 5-Azacytidine (5 μM or 10 μM) for 72 hr (n = 3). (B) HT29 cells were treated with SAHA (2 µM), or NaB (2 mM) for 24 h, and PTTG3P expression was measured. (C) After transfection with vector control, pcDNA/HDAC6, or pcDNA/HDAC8 for 24 h, PTTG3P expression in HT29 cells was measured by qRT-PCR. (D) MeRIP-qPCR showed the m6A modification expression in FHC cells as compared with the HT29 and HCT-116 cells. (E) The qRT-PCR analysis of PTTG3P levels in control and METTL3 overexpression in HT29 and HCT-116 cells. (F) The qRT-PCR analysis of PTTG3P levels in control and ALKBH5 overexpression in HT29 and HCT-116 cells. (G) RNA stability analysis showed the stability of PTTG3P in HT29 cells treated with actinomycin D (Act-D, 5 μg/m). (H) After transfection with vector or METTL3 for 24 h, the binding of PTTG3P and IGF2BP2 was analyzed by RIP-PCR in HT29 and HCT-116 cells. (I) After transfection with IGF2BP2 knockdown, the PTTG3P level increased by METTL3 was partly rescued. (J) METTL3 increased the level of YAP1 analyzed by qRT-PCR in HT-29 and HCT116 cells. (K) METTL3 and YAP1 are positively correlated from the TCGA database of colon adenocarcinoma (COAD). (L) PTTG3P co-expression heat map, TCGA (https://portal.gdc.cancer.gov/) COAD, level 3 HTSeq FPKM. Data are presented as the mean ± SD from three independent experiments. *p < 0.05, **p < 0.01, ***p < 0.001.

