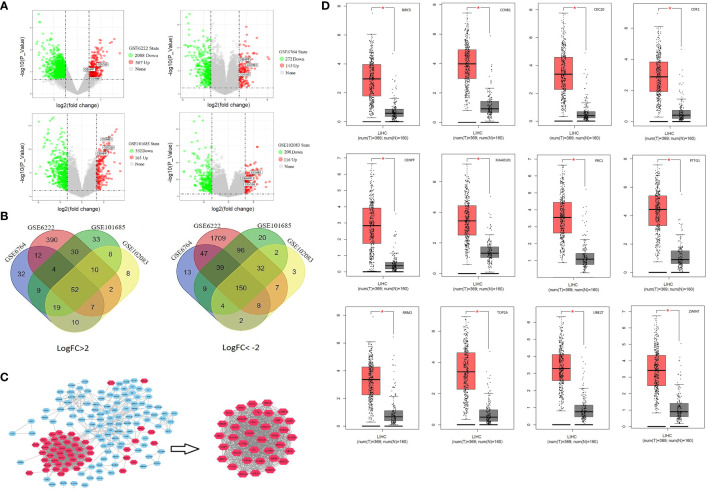
Figure 1.
Identify central cluster and gene expression validation: (A) Volcano plots of differentially expressed genes. (B) Venn Diagram of commonly up-/downregulated genes. (C) Screening of central cluster using MCODE plug-in. (D) Validation of central cluster genes expression in LIHC (liver hepatocellular carcinoma); red boxplot represents HCC tissue, and black box represents normal liver tissue. *P < 0.05.

