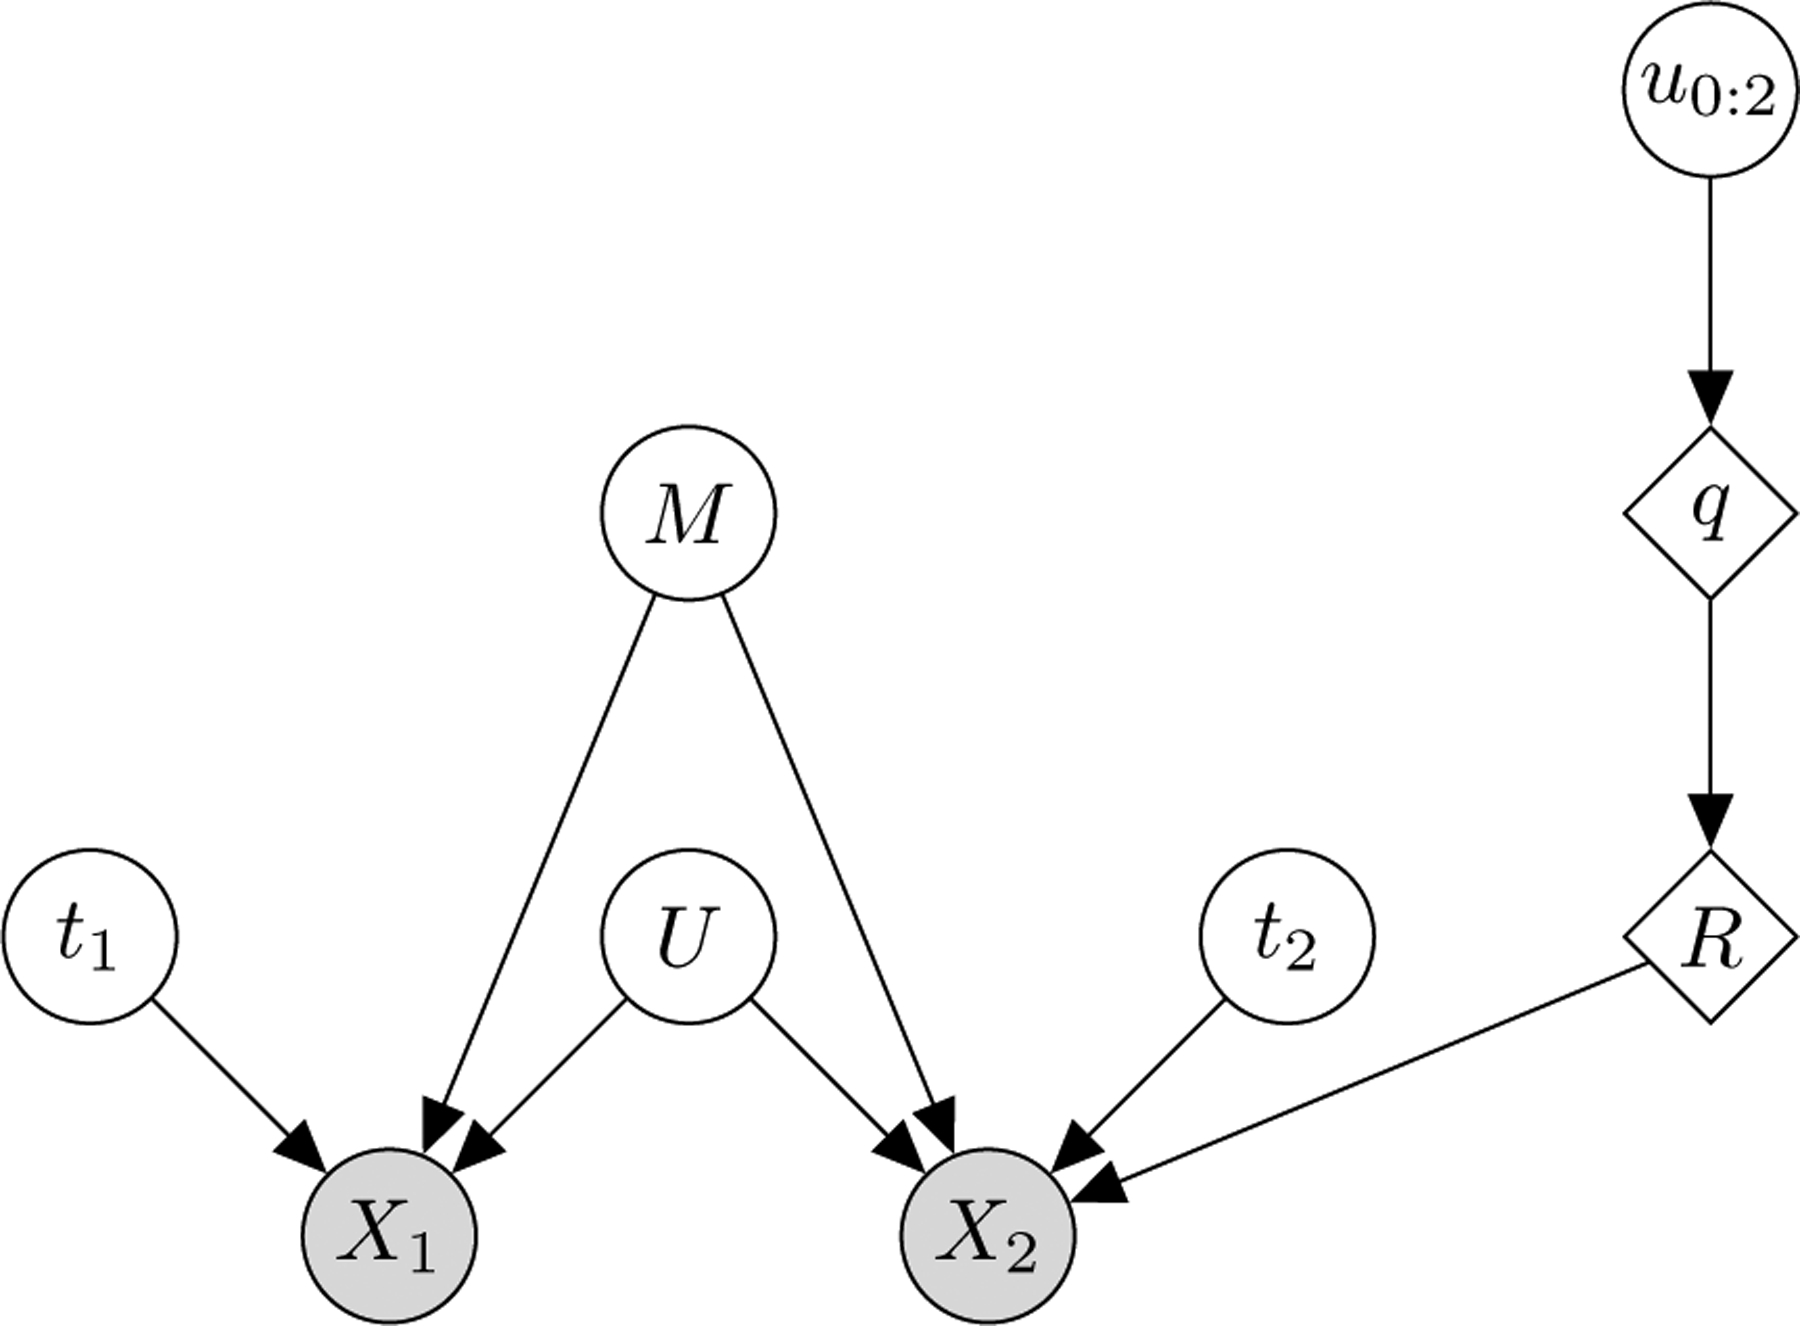
Fig. 1:

The THESEUS-PP model as a Bayesian graphical model. M is the latent, mean structure, which is an N-by-3 coordinate matrix, where N is the number of atoms. t1 and t2 are the translations. q is a unit quaternion calculated from three random variables u0:2 sampled from the unit interval and R is the corresponding rotation matrix. U is the among-row variance matrix of a matrix-normal distribution; X1 and X2 are N-by-3 coordinate matrices representing the proteins to be superimposed. Circles denote random variables; squares denote deterministic transformations of random variables. Shaded circles denote observed variables. Capital and small letters represent matrices and vectors respectively.
