Fig. 3:


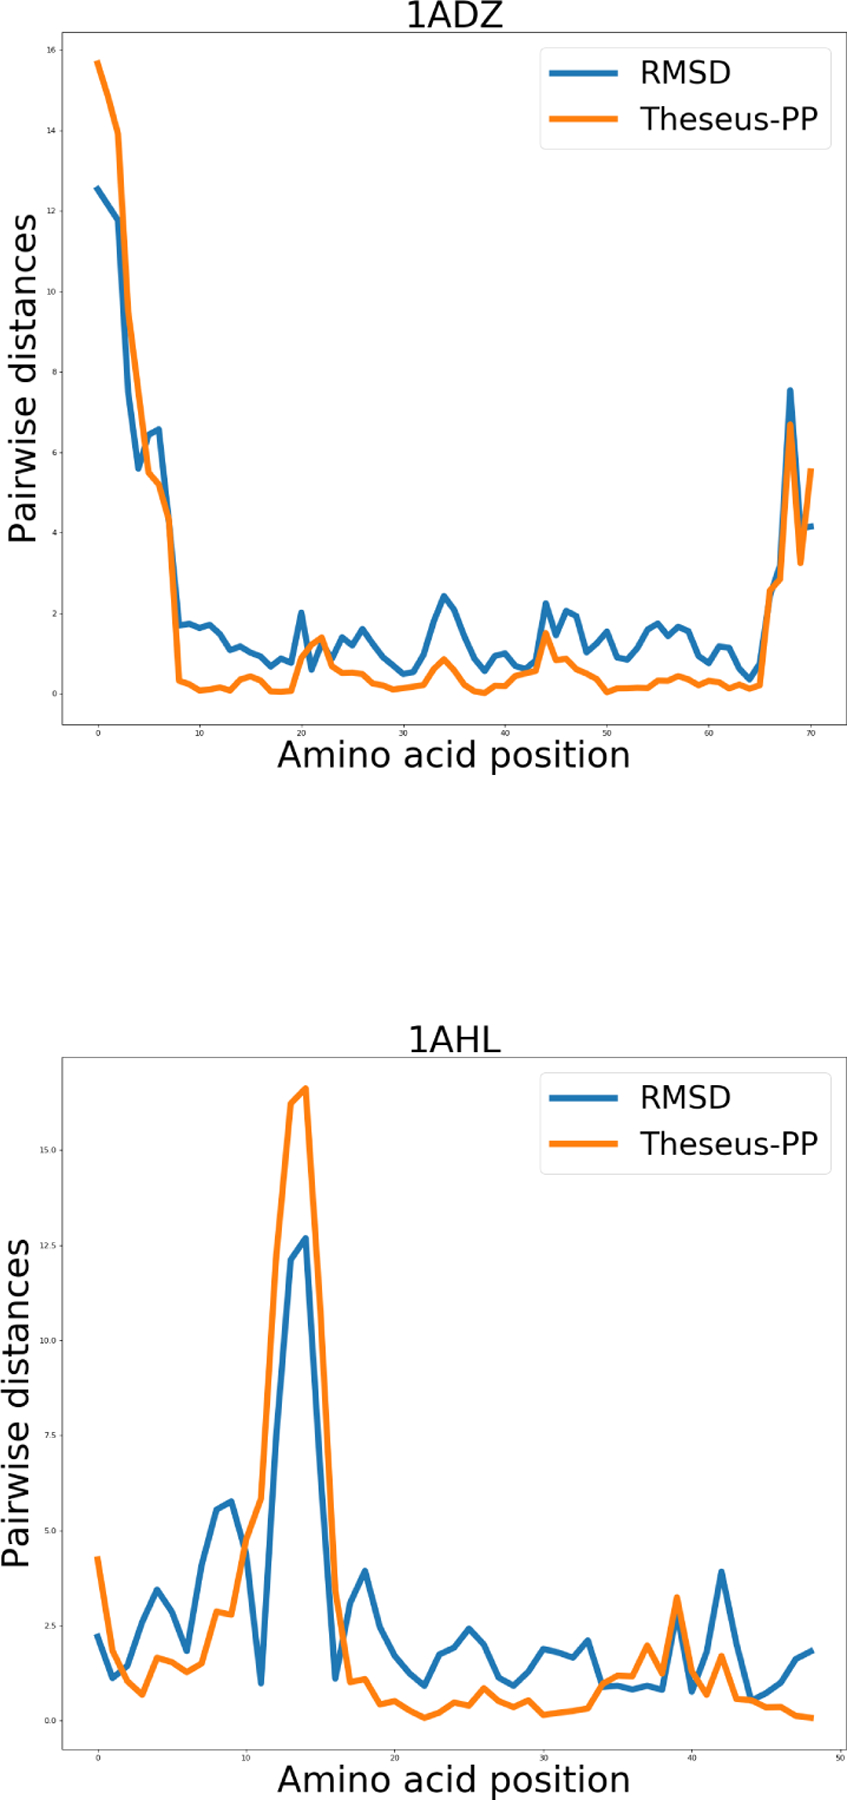
Graphs showing the pairwise distances (in Å) between the Cα coordinates of the structure pairs. The blue and orange lines represent RMSD and THESEUS-PP superposition, respectively.


Graphs showing the pairwise distances (in Å) between the Cα coordinates of the structure pairs. The blue and orange lines represent RMSD and THESEUS-PP superposition, respectively.