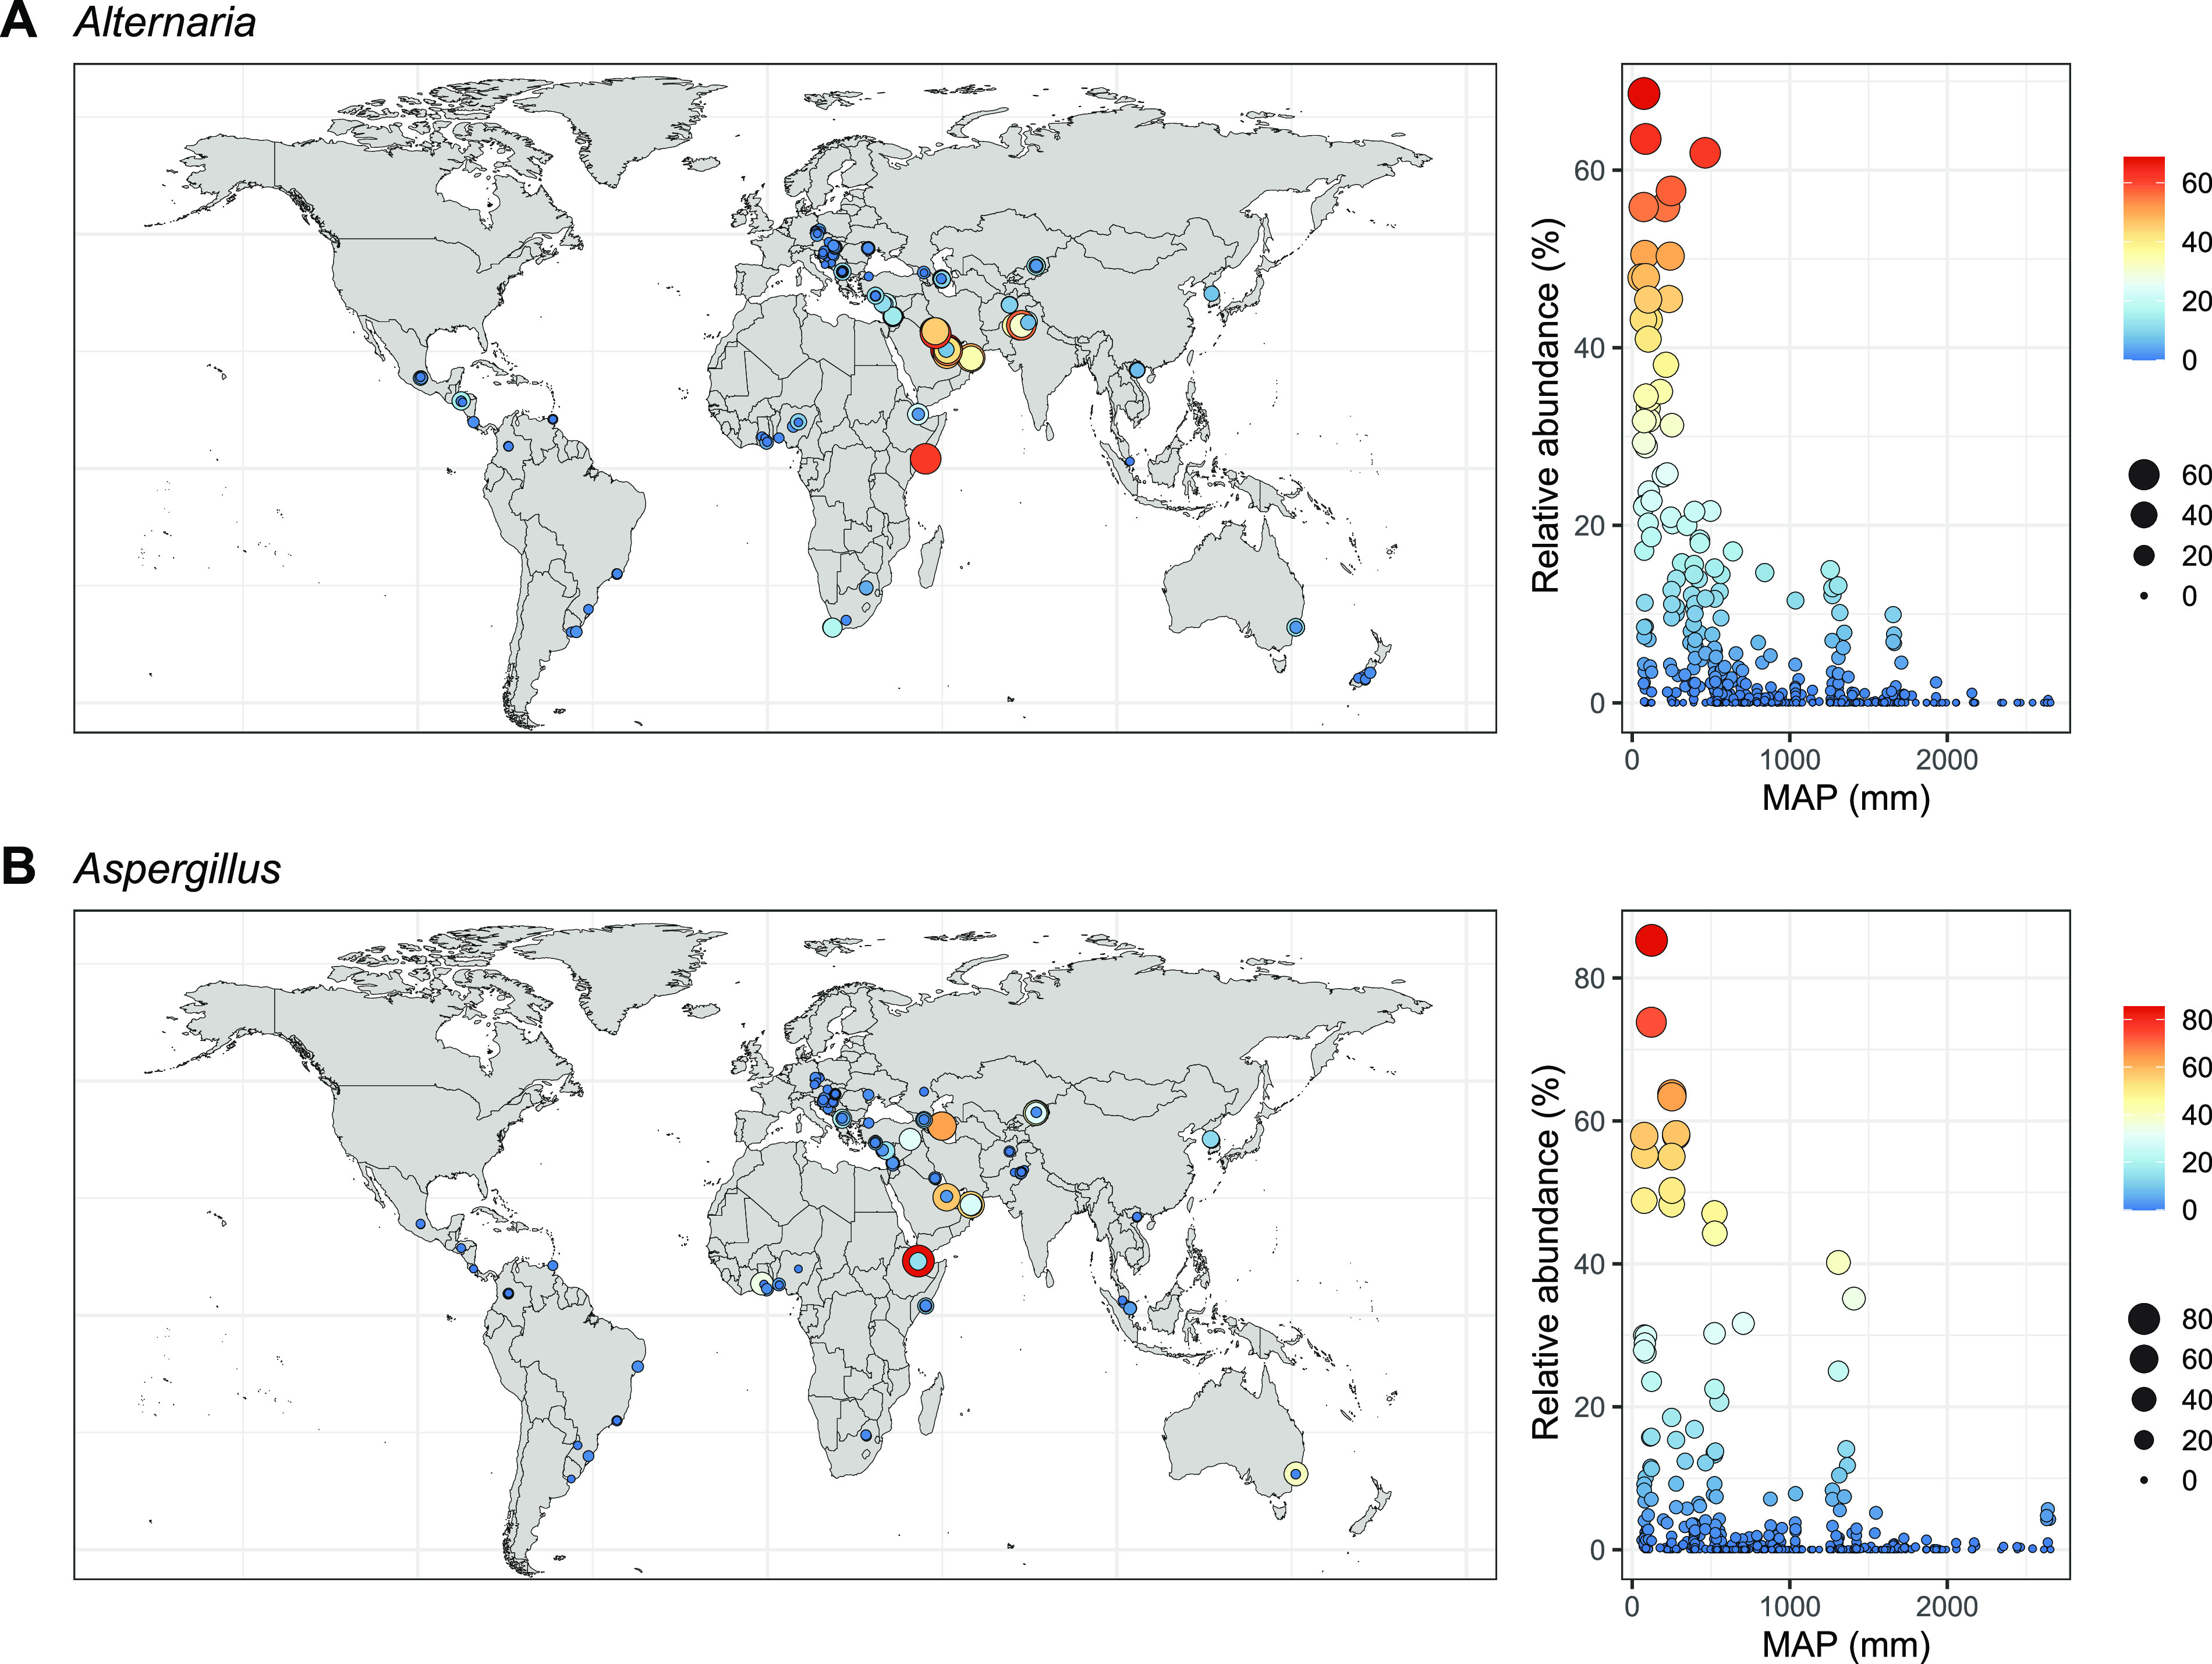
FIG 4.

Geographic patterns of the relative abundances of Alternaria (A) and Aspergillus (B). The color of the points indicates the relative abundance, and the point sizes are proportional to the relative abundance. Samples with zero relative abundance of either Alternaria or Aspergillus are omitted from the world map, but they are retained in the scatterplot. The relative abundances of both Alternaria (Spearman’s ρ = −0.42, P < 0.001) and Aspergillus (Spearman’s ρ = −0.26, P < 0.001) were negatively associated with mean annual precipitation (MAP).
