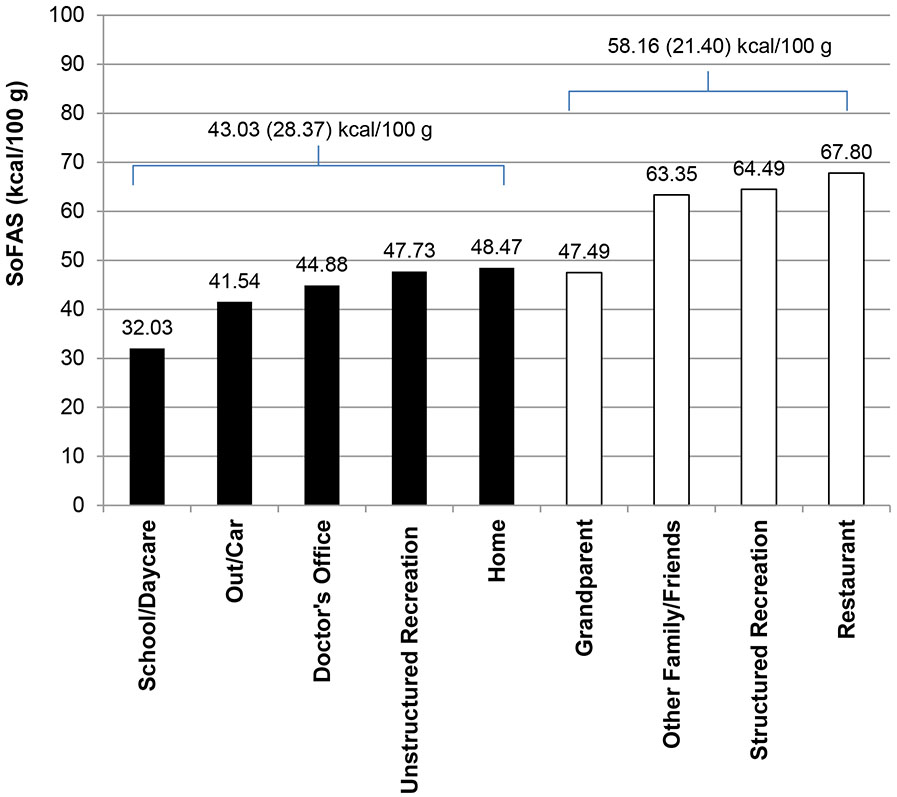
Figure 4. Mean SoFAS Content (kcal/100 g) of Snack Foods/Beverages by Contexts for Offering Snacks.
Note. Mean SoFAS content (kcal/100 g) of snack foods/beverages by routine (black bars) vs. social (white bars) contexts for offering snacks; Two-tailed independent t-test compared routine vs. social contexts, p<.001.

