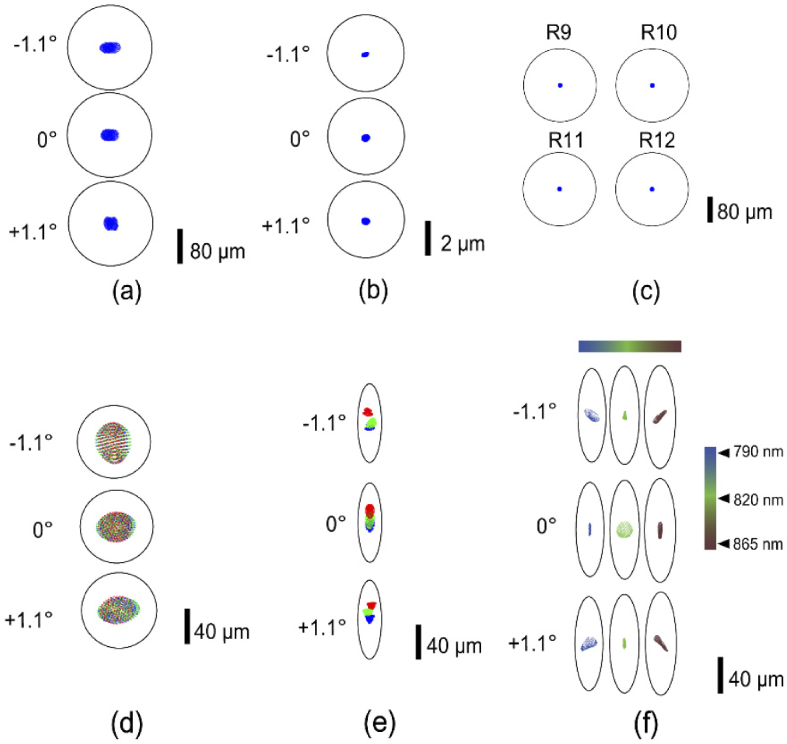
Fig. 3.
Spot diagram for (a) illumination path pupil plane (P4) (b) illumination path retinal plane (R4), (c) reference arm retinal plane (R9-R12) (d) Detection path pupil plane (P5) (e) Detection path retinal plane (R6) (f) Detection path retinal plane (R8) (d,e) green, blue and red (-1.1°,0°,1.1°) represents three field points along the line dimension. In (f) the color bar and the corresponding spot patterns indicate performance across the spectral bandwidth of OCT source illumination

