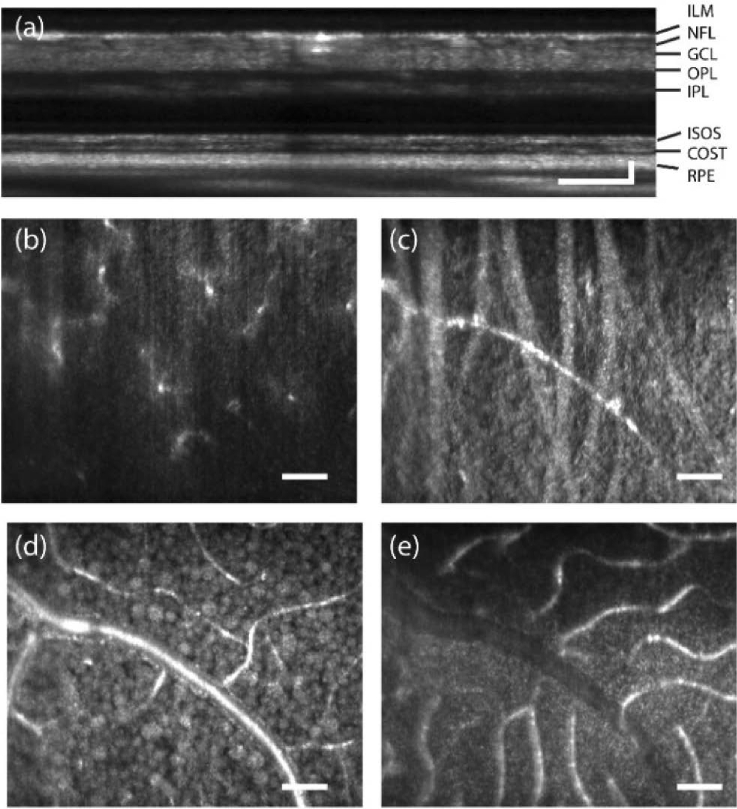
Fig. 7.
En face projection of inner retina (a) AO-OCT B-scan of retina at 10° temporal eccentricity in linear scale (b) Inner limiting membrane showing macrophages (c) Nerve fiber bundles (d) Retinal ganglion cells, (e) Blood vessels. ≈200 volumes were averaged, See Visualization 2 (2MB, avi) .avi Scale bar: 10 arcmin

