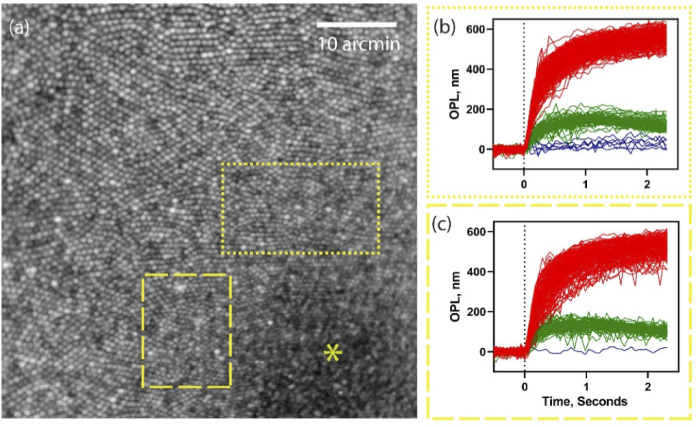
Fig. 8.
(a) En face projection of photoreceptors at the foveal center (b,c) Foveal cone optoretinograms corresponding to the dotted and dashed rectangular regions-of-interest in (a). Red, green, and blue color represent the response of long, middle and short wavelength cones. * - represents the foveal center.

