Figure 1.
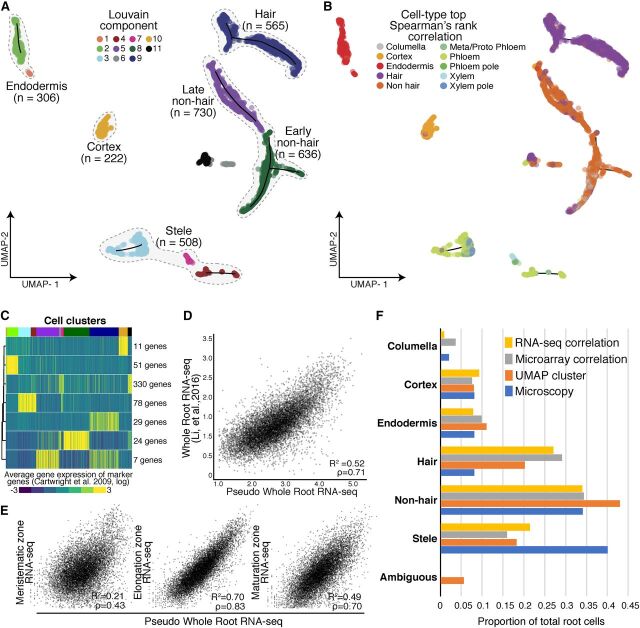
Annotation of Cell and Tissue Types for Single Cell RNA-Seq of Whole Arabidopsis Roots.
(A) Root cells were clustered and projected onto two-dimensional space with UMAP (McInnes and Healy, 2018). Solid circles represent individual cells; colors represent their respective Louvain component. Monocle 3 trajectories (black lines) are shown for clusters in which a trajectory could be identified.
(B) Solid circles represent individual cells; colors indicate cell and tissue type based on highest Spearman’s rank correlation with sorted tissue-specific bulk expression data (Brady et al., 2007; Cartwright et al., 2009).
(C) Known marker genes (Brady et al., 2007; Cartwright et al., 2009) were used to cluster single cell gene expression profiles based on similarity. The expression of 530 known marker genes was grouped into seven clusters, using k-means clustering. Mean expression for each cluster (rows) is presented for each cell (columns). Cells were ordered by their respective Louvain component indicated above by color (see (A), starting at component 1 at left). Number of genes in each cluster is denoted at right.
(D) Single cell RNA-Seq pseudo-bulked expression data are compared with bulk expression data of whole roots (Li et al., 2016).
(E) Single cell pseudo-bulk expression data are compared with bulk-expression data of the three developmental regions of the Arabidopsis root (Li et al., 2016).
(F) Proportions of cells as annotated by either UMAP (A), Spearman’s rank correlation (B), or Pearson’s rank (in Supplemental Figure 2), are compared with proportions determined by microscopy (Brady et al., 2007; Cartwright et al., 2009).

