
Figure 4.
Developmental Trajectory of Hair Cells.
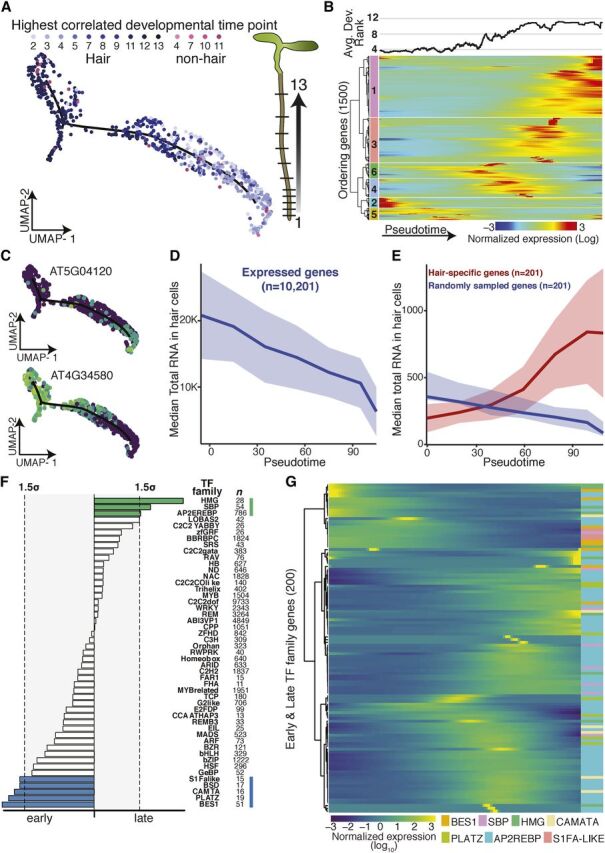
(A) UMAP-clustered hair cells were assigned a developmental time point based on highest Spearman’s rank correlation with bulk expression data of staged tissue (13 developmental stages; Brady et al., 2007; Cartwright et al., 2009). Cell type and developmental time points are indicated in shades of blue (and pink). Graphic illustrates developmental stages in Arabidopsis root (plant illustrations).
(B) Cells were ordered in pseudotime; columns represent cells, rows represent expression of the 1,500 ordering genes. Rows were grouped based on similarity in gene expression, resulting in six clusters (indicated left), with genes in clusters 2 and 5 expressed early in pseudotime, and genes in cluster 1 expressed late. Hair cells with the earliest developmental signal (Brady et al., 2007; Cartwright et al., 2009) were designated as the root of the trajectory. The graph above represents the average best-correlation of developmental stage (Brady et al., 2007; Cartwright et al., 2009) in a scrolling window of 20 cells with pseudotime, showing the expected increase in developmental age with increasing pseudotime.
(C) Examples of an early and a late expressed hair-cell–specific gene. Gene expression in each cell is superimposed onto the UMAP cluster and trajectory, with lighter colors indicating higher gene expression.
(D) Median total RNA captured in cells decreases across pseudotime. Number of genes included is indicated.
(E) Comparison of median total RNA for hair-cell–specific genes (in red) to a comparable random set of genes (in blue). Number of genes is indicated (Permutation test P value ≈10−4).
(F) Different transcription factor motifs reside in the 500-bp upstream regions of genes expressed early (clusters 2 and 5) compared with genes expressed late (cluster 1). Transcription factor motifs specific to early hair cells are denoted with blue bars, those for late hair cells with green bars; bar length indicates motif frequency. Thresholds on either side (gray box, dotted lines) refer to 1.5 sd above mean motif frequency.
(G) Expression of individual members of transcription factors families highlighted in (D) across pseudotime identifies candidate factors driving early or late gene expression.