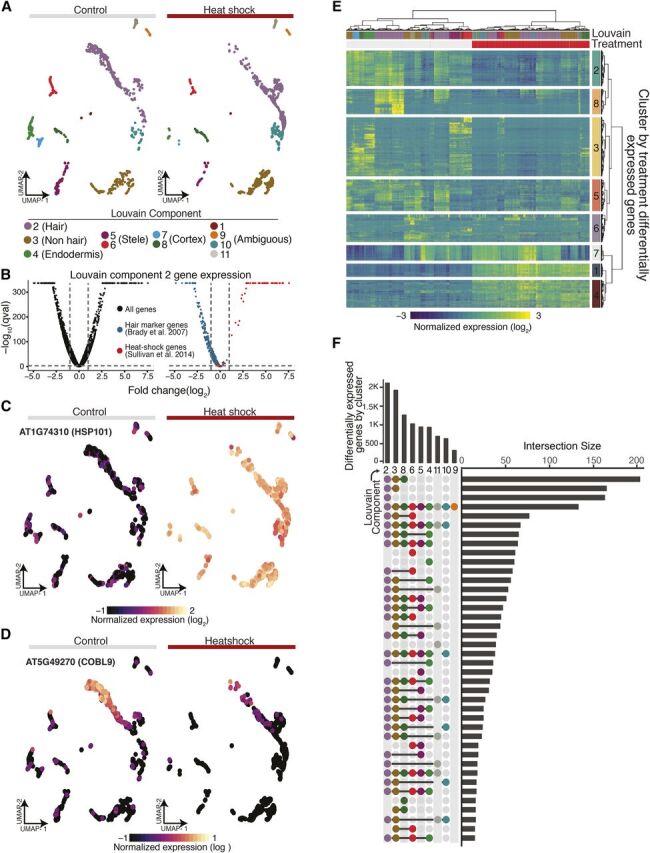
Figure 7.

Single-Cell RNA-Seq Highlights Canonical and Novel Aspects of the Heat-Shock Response.
(A) A nearest-neighbor approach aligns control and heat-shocked cells in a UMAP embedding to allow for concomitant cluster/cell-type assignment.
(B) Volcano plots of average gene expression change upon heat shock within Louvain component 2 for all genes (black), known hair marker genes (blue), and heat-shock signature genes (red).
(C) HSP101, a signature heat-shock gene, shows dramatic increase of expression in all cell types upon heat shock.
(D) COBL9, a well-studied hair marker gene, is strongly repressed upon heat shock.
(E) Heat map of differentially expressed genes upon heat shock (top red bar; control, top gray bar), hierarchically clustered by both cells and genes (FDR < 0.1% and absolute value of the log2 fold change > 1).
(F) “Upset” plot (Lex et al., 2014) of the number of differentially expressed genes as a function of heat shock for each Louvain cluster in our UMAP embedding (bars on top) along with the number of the intersect of differentially expressed genes between Louvain clusters (bars on the right). A surprising number of differentially expressed genes were specific to certain clusters (single dot in vertical row of dots).
