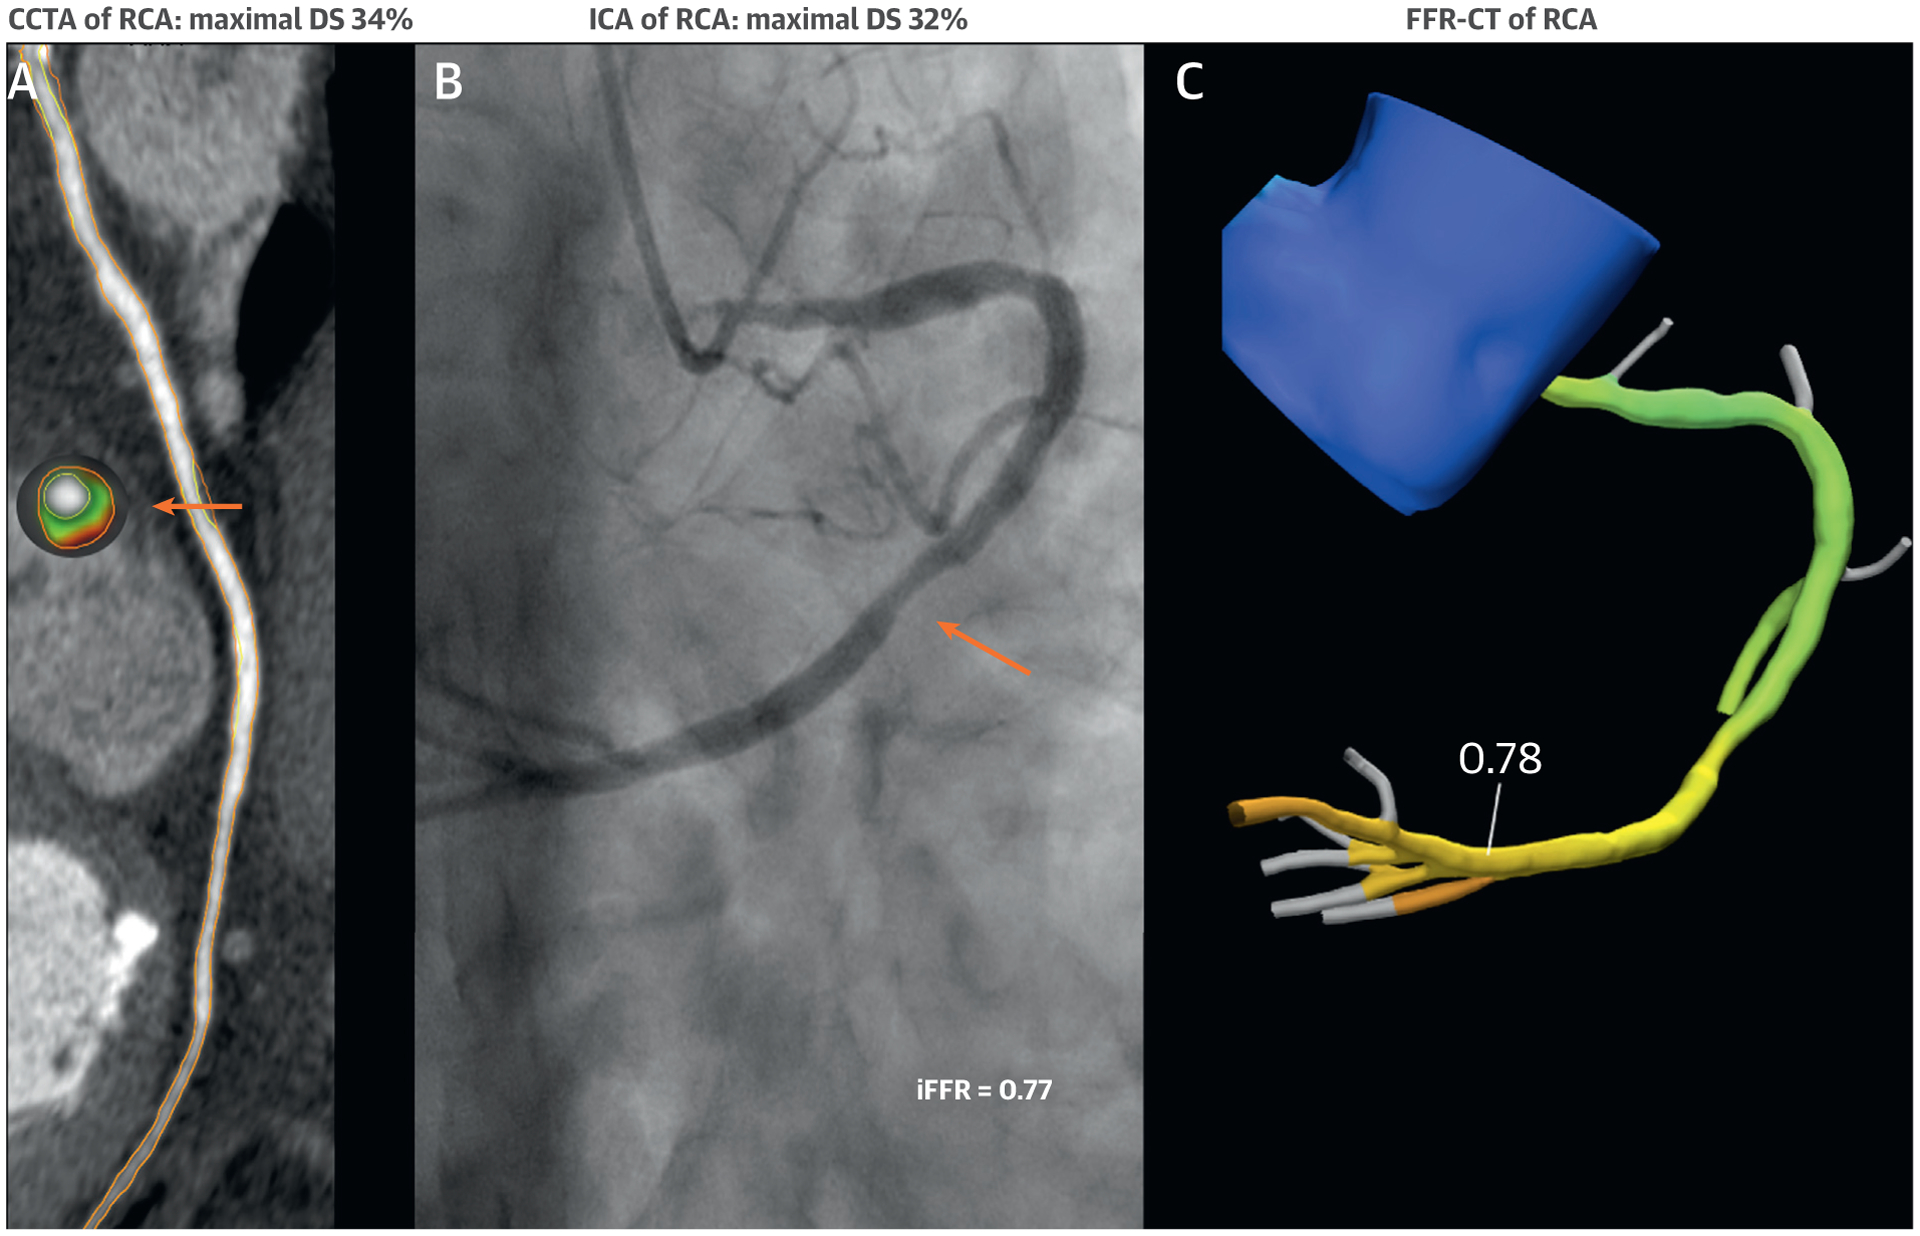
FIGURE 5. Integrated Imaging Findings of Case 3.

(A) Coronary computed tomography angiography (CCTA) of the RCA. Orange arrows indicate the cross section of maximal DS. On the cross-sectional level, red indicates necrotic core <30 HU; light green indicates fibrofatty plaque 31–130 HU; and dark green indicates fibrous plaque 131–350 HU. (B) Invasive coronary angiography (ICA) of the RCA with invasive fractional flow reserve (iFFR) measurements. (C) FFR derived from computed tomography (FFR-CT) of the RCA. Abbreviations as in Figure 1.
