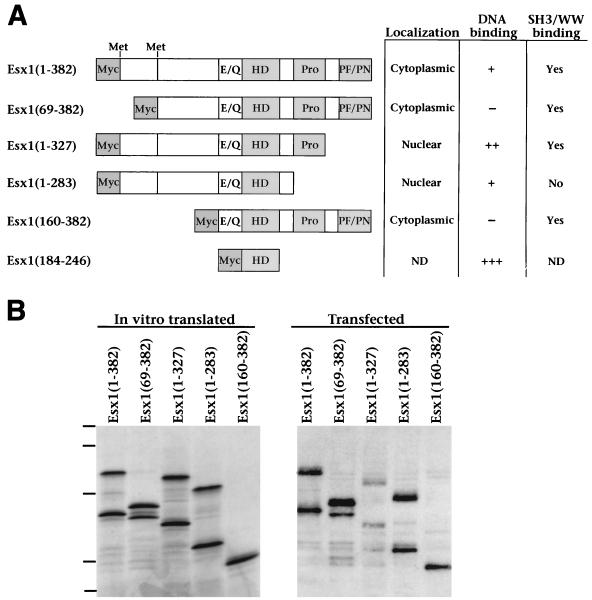
FIG. 4.
Analysis of ESX1 protein motifs. (A) Diagram of the full-length and truncated ESX1 proteins. Shown are the glutamic acid- and glutamine-rich region (E/Q), the homeodomain (HD), the proline-rich region (Pro), and the PF/PN region. The numbering of amino acid sequences (indicated in parentheses) is based on the product of transcript A, such that ESX1(1–382) corresponds to the product of transcript A and ESX1(69–382) corresponds to the product of transcript B. Also indicated are the positions of the two alternative initiator methionines for transcripts A and B at amino acids 1 and 69, respectively. The truncated ESX1 proteins also contain an N-terminal Myc epitope as indicated. The table on the right summarizes the subcellular localization, DNA binding properties, and SH3/WW domain interactions for each ESX1 protein; primary data are shown in Fig. 5 to 7. Symbols: +++, strong DNA binding activity; ++ and +, weaker binding activity; −, no detectable binding activity; ND, not determined. (B) Comparison of ESX1 proteins produced by in vitro transcription-translation or by transfected mammalian cells. For in vitro transcription-translation (left), pcDNA3-Esx1 plasmids encoding the indicated proteins were used to synthesize the corresponding mRNA and this was followed by translation with rabbit reticulyocyte lysate in the presence of [35S]methionine. In vitro-translated proteins (3 μl) were resolved by SDS-PAGE (12% polyacrylamide) and visualized by autoradiography. For expression in mammalian cells (right), these pcDNA3-Esx1 plasmids were transfected into COS1 cells and cellular proteins were extracted in SDS lysis buffer. Cell lysates (15 μl) were resolved by SDS-PAGE (12% polyacrylamide) and visualized by Western blot analysis with anti-ESX1 antisera. Dashes correspond to molecular mass standards of 110, 68, 45, 31, and 20 kDa.

