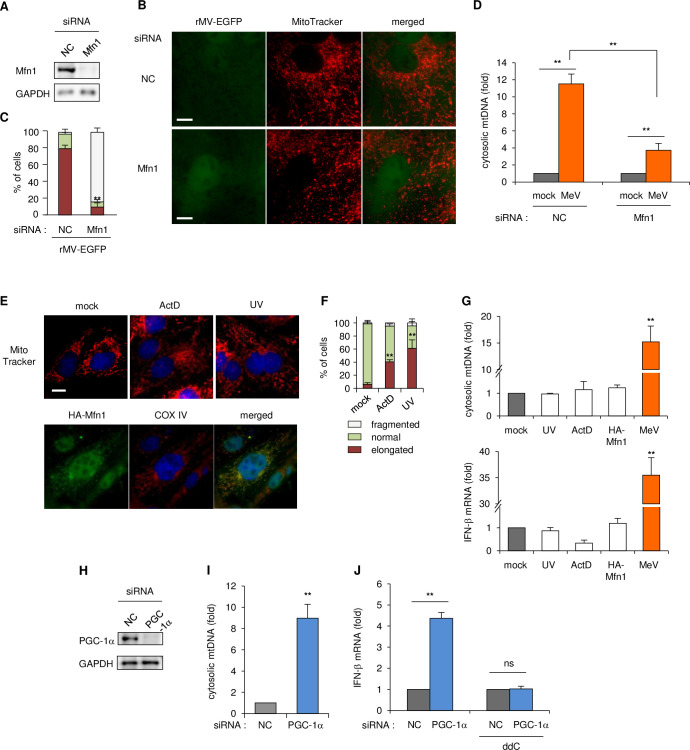
Fig 3. The role of Mfn1 in the downregulation of mitochondrial biogenesis in the mtDNA-priming antiviral response.
(A-C) Vero-hSLAM cells were transfected with siRNA for the NC or Mfn1. (A) Cell lysates analyzed to western blotting. (B) Cells infected with rMV-EGFP. At 16 hpi, mitochondria were stained with MitoTracker. Scale bar = 10 μm. (C) Mitochondria morphology of at least 30 cells per condition and in three independent experiments were classified as normal, elongated, or fragmented mitochondrial network. (D) Mfn1 knockdown cells were infected with the mock control or MeV, and cytosolic mtDNA levels were measured by qPCR, as described above. (E) Upper: Vero-hSLAM cells were treated with 3 μg/ml ActD or irradiated with 60 mJ/cm2 UV-C. Mitochondria and nuclei were stained 7 h later with MitoTracker and Hoechst, respectively. Lower: Cells were transfected with plasmid expressing HA-tagged Mfn1 and then stained with antibodies to COX IV for mitochondria and to the HA tag, and Hoechst. Scale bar = 10 μm. (F) Mitochondrial morphology of ~30 cells per condition and in two experiments were classified as normal, elongated, or fragmented mitochondrial network. (G) Cells were irradiated with UV, treated with ActD for 7 h, transfected with HA-Mfn1 plasmid, or infected with MeV for 24 h. Upper: cells were harvested and cytosolic mtDNA was measured by qPCR, as described above. Lower: total RNA was subjected to RT-qPCR to analyze IFN-β mRNA. (H) Immunoblot of MCF7 cells transfected with siRNA for the NC or PGC-1α. (I) MCF cells transfected with siRNA for the NC or PGC-1α, and cytosolic mtDNA was quantified by qPCR at 5 d post-transfection. Data are represented as the relative number of PGC-1α knockdown cells to that of NC-transfected cells. (J) MCF7 cells were treated with the mock control or ddC for 3 d and then transfected with siRNA for the NC or PGC-1α. After 4 d, RNA was harvested and the mRNA levels of IFN-β were measured by RT-qPCR. Data are representative of three independent experiments. Data are the mean value ± SD (n = 3). Statistical significance was determined using an unpaired Student’s t-test; *P < 0.05; **P < 0.01; ns, not significant (P > 0.05).

