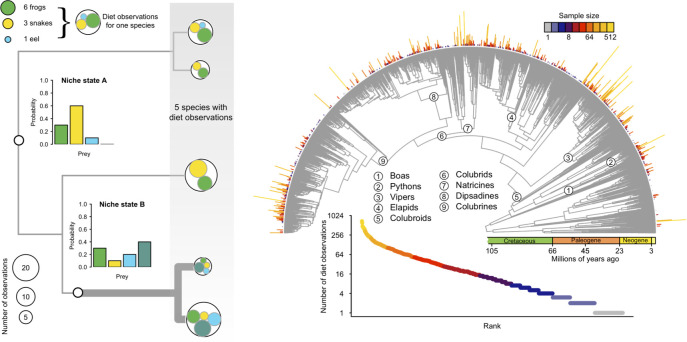
Fig 1.
Inference model (left) and empirical dataset (right) used for the reconstruction of multivariate ecological phenotypes on phylogenetic trees. Left: Hypothetical sample data illustrating the use of primary natural history data for estimating dietary niches. Observed data are the sets of counts of different prey items recorded in the sampled diets of 5 hypothetical species. Subcircles (green, yellow, and blue) denote the number of observations of different food resources within each of the 5 hypothetical species (open circles). These data represent “primary natural history data” as they originate from direct observations of organisms in nature or from examination of museum specimens. The model we developed assumes these data are generated from a set of latent (unobserved) niche states that correspond to distinct multinomial distributions over a set of prey categories (inset bar plots). The inference framework uses the observed data and phylogeny to infer the set of latent niche states and their phylogenetic distribution. Here, an ancestral niche state (thin branches) underwent a trophic shift to niche state “B” (thick branches), resulting in a paraphyletic assemblage of 3 species that share the ancestral niche state (“A”) and a set of 2 species characterized by the derived niche state (“B”). The derived state in this example is associated with trophic expansion, adding a novel resource (shown in teal) to the proportional prey utilization spectrum. Note that sampled diets for individual species vary, even for those sharing a common niche state, because the “true” niche state is assumed to be a probability distribution and is therefore characterized by intraspecific sampling variability. Right: Comprehensive species-level phylogeny of snakes from [47] highlighting major clades, evolutionary timescale, and sample size distribution for number of prey use observations. Rank abundance curve below the phylogeny and segments along the outer semicircle depict the sample size distribution for all snakes with diet observations. Gaps along the outer semicircle occur for species with no diet observations, and these species were pruned from the phylogeny prior to analysis. A total of 34,060 primary natural history observations of prey acquisition by 882 species of snakes were collated for analysis. The data underlying this figure may be found in doi: 10.5281/zenodo.4446064.

