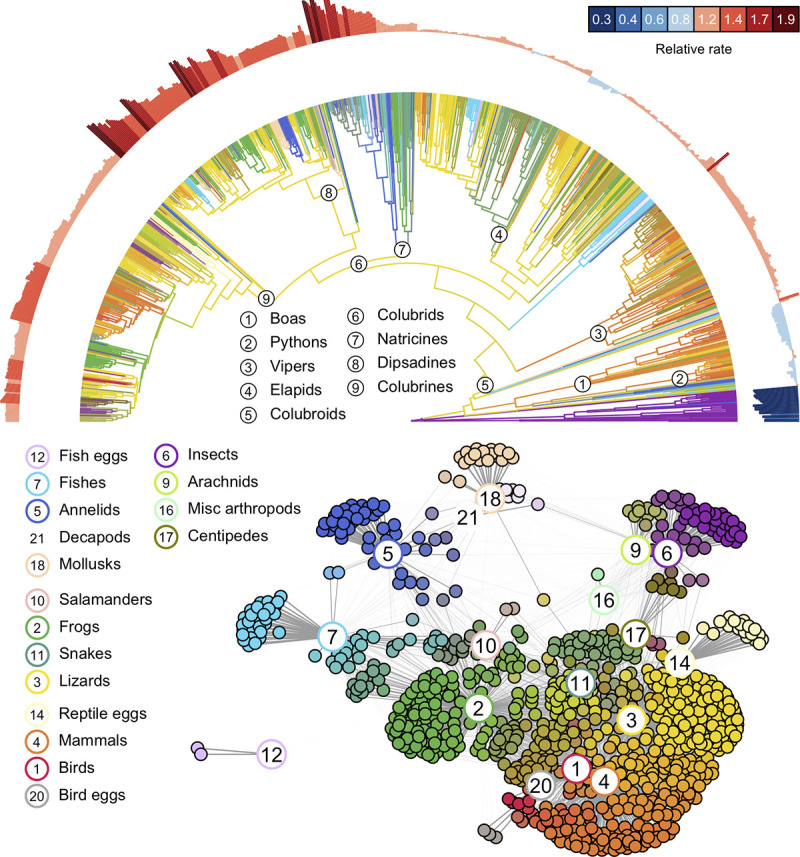
Fig 2.

Evolutionary dynamics of diet evolution across the radiation of extant snakes (top) and model inferred trophic network structure (bottom) estimated from 34,060 primary natural history observations of prey acquisition. Top: Reconstructions of ancestral snake diets (branch colors) and evolutionary rates of prey switching (outer semicircle) were inferred using a Dirichlet-multinomial Markov model for multivariate ecological trait evolution. Branch colors denote reconstructed patterns of resource use and are colored according to the same scheme used in the bottom panel. Outer semicircle denotes average rates of diet evolution for each taxon expressed relative to the average for all snakes (see text for details). Evolutionary rates are higher for the colubroid mega-radiation, which accounts for the majority of global snake diversity. Despite generally lower evolutionary rates, however, non-colubroid snakes display a similar breadth of feeding modalities as colubroids. Time-calibrated phylogeny for the 882 species for which diet observations were available was taken from [47]. Bottom: Graphical network illustrating connections between prey types (numbered circles) and individual snake taxa (filled circles). Lines connect snake taxa to prey items in their diets, and line widths are proportional to the model-estimated relative importance of each prey item to a given taxon’s diet. Each prey item is represented by a color (shown by the borders of numbered circles), and the color assigned to an individual snake species is an additive mixture of the colors of the prey items it feeds on. Prey items that commonly co-occur in snake diets are positioned near one another, as are snakes with similar diets. Several rare prey categories (crocodilians, turtles, amphibian eggs, amphibian larvae, and caecilians) are not included here but do not qualitatively alter the appearance of the overall trophic network. The data underlying this figure may be found in doi: 10.5281/zenodo.4446064.
