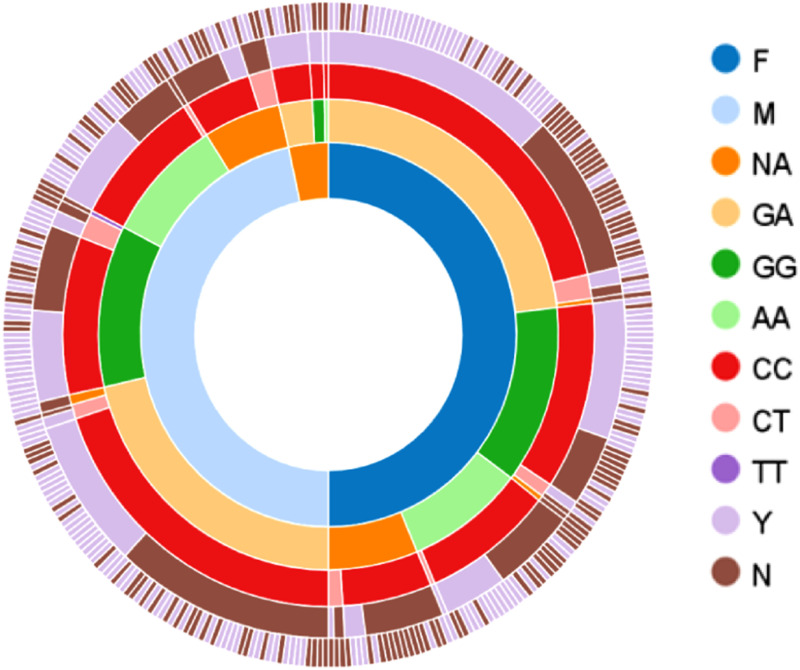
Fig 2. Sunburst figure shows the distribution of all samples (n = 350) among different categories.
The first inner circle indicates the gender (175 females (F), 163 males (M), and 12 not available (NA)), while the second and third circles show different genotypes of rs1761667 (n = 310) and rs1527483 (n = 347), respectively. The fourth and fifth ones represent diabetes (yes (Y) = 177, and no (N) = 173) and dyslipidemia (Y = 201, and N = 149) status, respectively.

