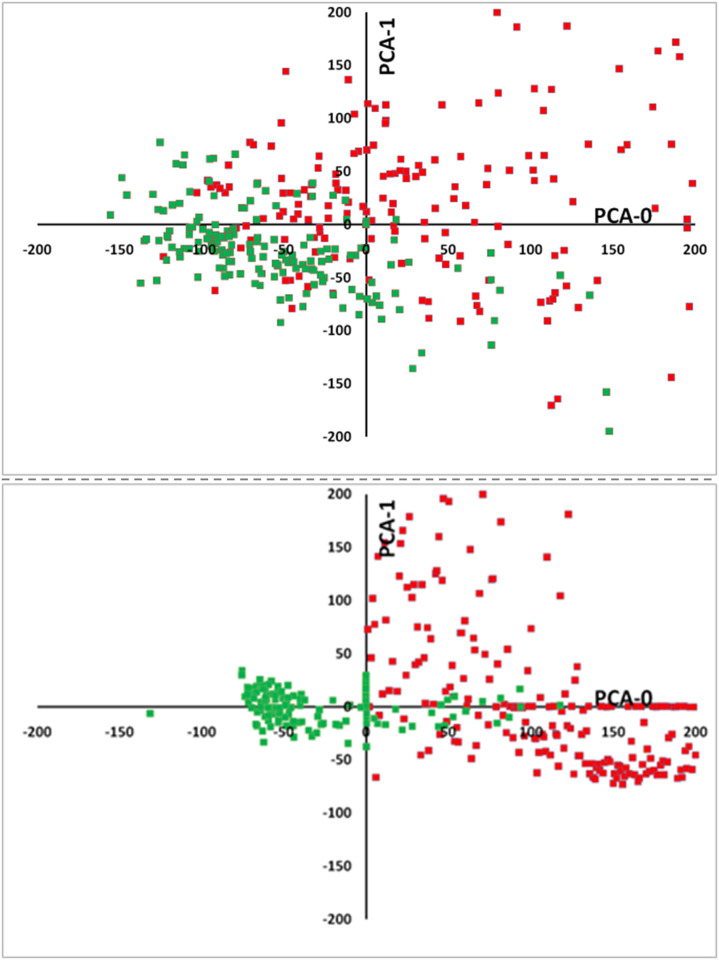
Fig 3. Two-dimensional plots showing two main principal components.
In the upper graph, five input features (LDL, HDL, TG, TC and Age) were calculated for subjects with diabetes (red squares) compared to all control subjects (green squares). In the lower graph, two input features (FBS and Age) were calculated for all subjects with dyslipidemia (red squares) compared to all control subjects (green squares). The clinical parameters used to define the diseases (lipid profile for dyslipidemia, and FBS for T2DM) were excluded from the input data as described before.

