Fig 6.

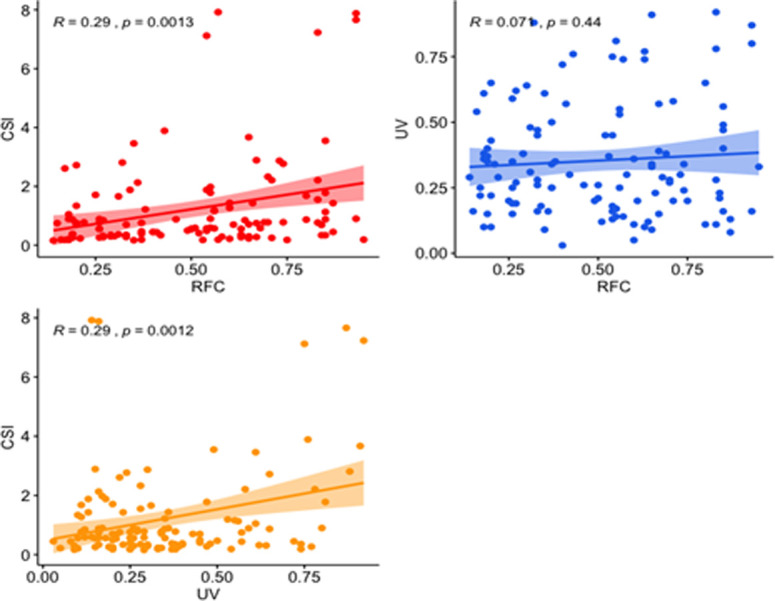
The scatter plot representing correlation for a) RFC vs SCI, b) UV vs RFC and c) CSI vs UV of the vegetation studied at Head Maralla.

The scatter plot representing correlation for a) RFC vs SCI, b) UV vs RFC and c) CSI vs UV of the vegetation studied at Head Maralla.