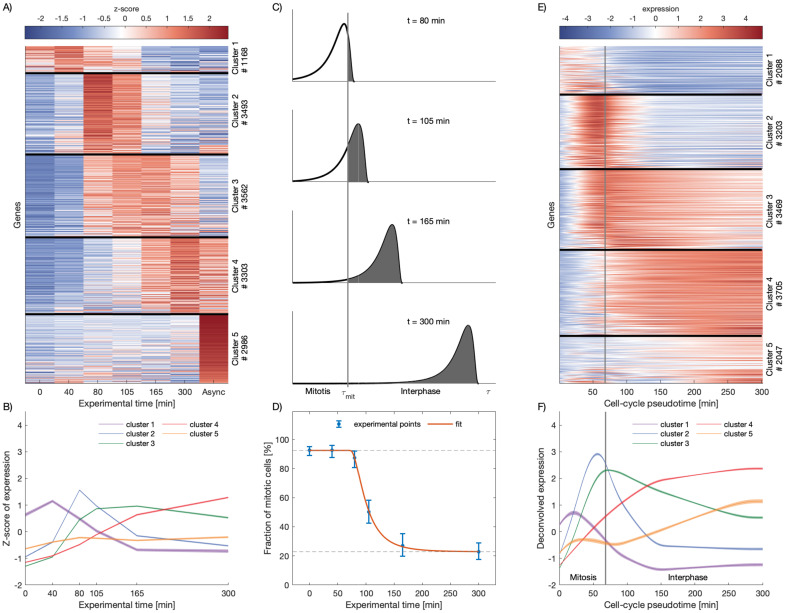
Fig 1. Deconvolution of gene expression data of synchronized cell populations leads to dynamic expression profiles respect to cell-cycle pseudotime.
A: Genes can be clustered in groups according to their dynamic expression profiles over time. Each row corresponds to a gene. Black horizontal lines divide the different clusters of genes. The color scale represents the level of the Z-score of expression of each gene, as shown by the colorbar on the top. The number of genes in each cluster is indicated on the right. B: Average expression profiles for each cluster in A. Shades show standard errors of the mean. C: Distributions of cells over the cell-cycle pseudotime at different experimental time points assuming that cells have to wait a stochastic, log-normally distributed lag time to start again the cell-cycle progression after the release of nocodazole (see Methods). The gray shaded areas represent the fraction of cells that exited mitosis at different experimental times. Grey vertical indicates the time τmit that cells need to complete mitosis. D: Fraction of mitotic cells (blue dots) quantified by imaging of cells showing condensed (mitotic) and decondensed (non-mitotic) chromatin after mitotic block release (data from [14]). Error bars show confidence intervals from a simple binomial model. Red line shows the model of fraction of mitotic cells fitted to the experimental data to infer τmit and the parameters of the log-normal distribution, σ and μ. The dashed lines show the contamination level with asynchronous cells (top) and the contamination level with cells that did not renter the cell cycle after block was released (bottom). E: After the deconvolution, genes are clustered in groups according their dynamic expression profile over the cell-cycle pseudotime τ. The vertical white line represents τmit and indicates the transition between mitosis to early G1 phase. The color scale represents the level of expression of each gene, as shown by the colorbar on the top. The number of genes in each cluster is indicated on the right. F: Average expression profiles for each cluster in E. Shades show standard errors of the mean. Time units are in minutes.

