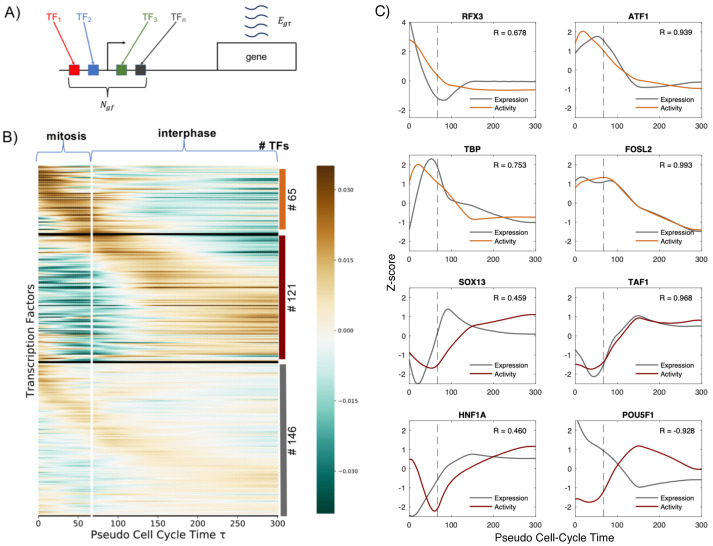
Fig 2. Transcription factor activity dynamics during mitosis and early G1 phase.
A: Schematic representation of the model: the expression egτ of the gene g at cell-cycle pseudotime τ is a linear combination of the activities of different transcription factors f binding the promoter of g. Ngf represents the entries of a matrix N containing the number of sites for TF f associated with promoter of the gene g, taking into account the affinity between the motif of f and the sequence of the promoter. B: Heatmap showing TF activities for expressed TFs in HUH7. The TF activity level is color coded and the scale is shown in the colorbar. The vertical white line represents τmit, and indicates the transition between mitosis and interphase. TFs are clustered using k-means according to their activity dynamics over the cell-cycle pseudotime τ. Three main groups are detected: mitotic-active, earl-G-active and steady-active. Within each cluster TFs are sorted according to when their maximum activity occurs. On the right, the number of TFs belonging to each cluster is indicated. C: Activities of mitotic-active (orange curves) and early-G1-active (red curves) TFs that show a high amplitude dynamics. Grey lines show the gene expression dynamics of the corresponding TF genes. Z-score transformation was applied to facilitate the comparison of the expression and activity dynamics. Pearson correlation coefficients between the TF activities and expressions are shown in each panel. Dashed lines represent τmit. Time units are minutes in all plots.

