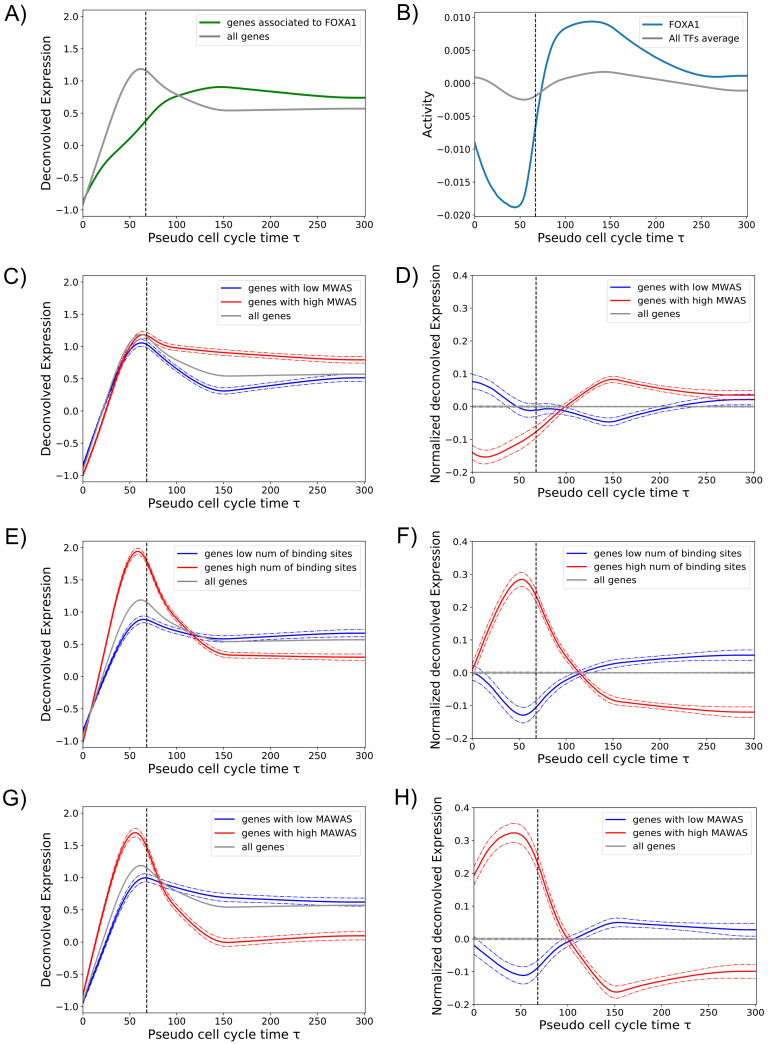
Fig 4. Bookmarking and transcription reactivation dynamics.
A: The average expression of all genes (grey line) was compared with the average expression of FOXA1 target genes during mitosis (green line). B: The activity of FOXA1 (blue line) in comparison with the average activity of all TFs (grey line). C: Gene expression pattern as a function of the promoter MBS (mitotic binding score). The average expression of all genes (grey line) was compared to the average expression of genes whose promoters tend to be regulated by TFs with high MBF (red line) and low MBF (blue line) (see Methods). D: The same as in panel C, but gene expression patterns have been processed as described in Methods, Eq 16. E: Gene expression pattern as a function of the total number of TF binding sites in the promoter. The average expression of genes with large (red) and low (blue) number of promoter binding sites are compared to the overall average expression (grey line). F: The same as in panel E, but gene expression patterns have been processed as described in Methods, Eq 16. G: Gene expression pattern as a function of the promoter MAS (mitotic activity score, see Methods). The average expression of genes with high (red) and low (blue) MAS are compared to the overall average expression (grey line). H: The same as in panel G, but gene expression patterns have been processed as described in Methods, Eq 16. Dashed vertical lines in all panels indicate τmit.

