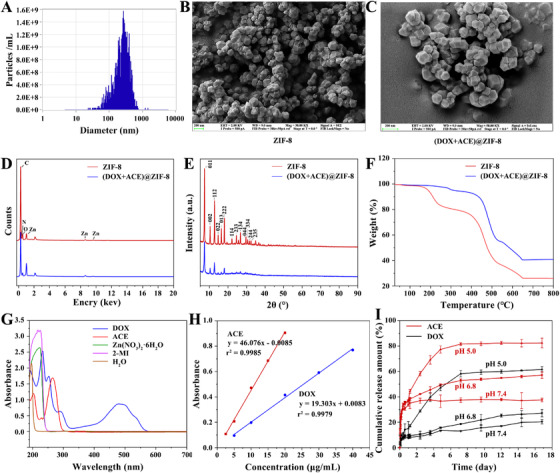
FIGURE 2.

Characterization of (DOX+ACE)@ZIF‐8. A, Particle size distribution of (DOX+ACE)@ZIF‐8 measured by dynamic light scattering. B and C, Representative SEM images of ZIF‐8 and (DOX+ACE)@ZIF‐8; scale bars, 200 nm. D, Elemental distribution of ZIF‐8 and (DOX+ACE)@ZIF‐8 mapped by energy‐dispersive X‐ray spectroscopy. E, XRD spectra of ZIF‐8 and (DOX+ACE). F, TGA analysis of ZIF‐8 and (DOX+ACE). G, UV‐Vis DRS spectra of DOX, ACE, Zn(NO3)2, 2‐MI, and H2O. H, The standard curve of DOX at 480 nm and ACE at 262 nm. I, pH‐responsive release of DOX and ACE from (DOX+ACE)@ZIF‐8 in PBS (pH 5.0, 6.8, and 7.4) at 37°C
