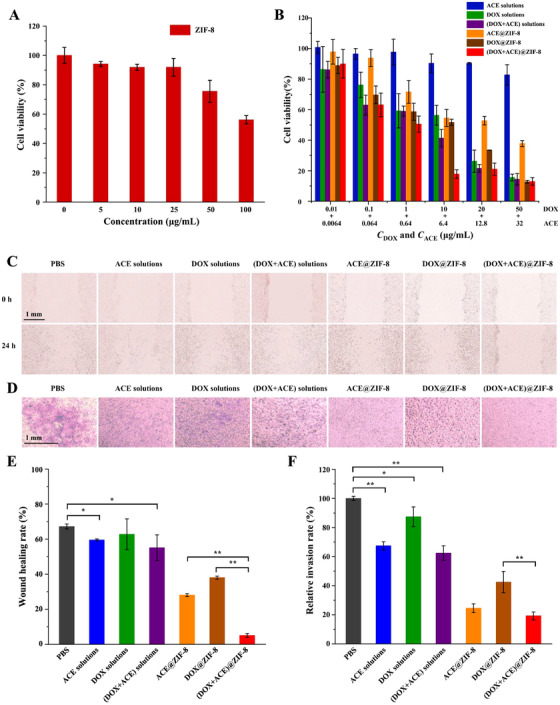
FIGURE 3.

A, Cell inhibition rates of ZIF‐8 to HL7702 cells after 48 h of incubation (n = 5). B, Cell inhibition rates of ACE solutions, DOX solutions, (DOX+ACE) solutions, ACE@ZIF‐8, DOX@ZIF‐8, and (DOX+ACE)@ZIF‐8 to Walker 256 cells (n = 5). C and D, Representative images of cell migration and invasion of Walker 256 cells after treatment with PBS, ACE solutions, DOX solutions, (DOX+ACE) solutions, ACE@ZIF‐8, DOX@ZIF‐8, and (DOX+ACE)@ZIF‐8 for 24 h (n = 3). E and F, Wound healing rates and invasion rates of Walker 256 cells responding to wound healing assay (C) and transwell assay (D), respectively. Scale bar, 1 mm. *P < 0.05, **P < 0.01
