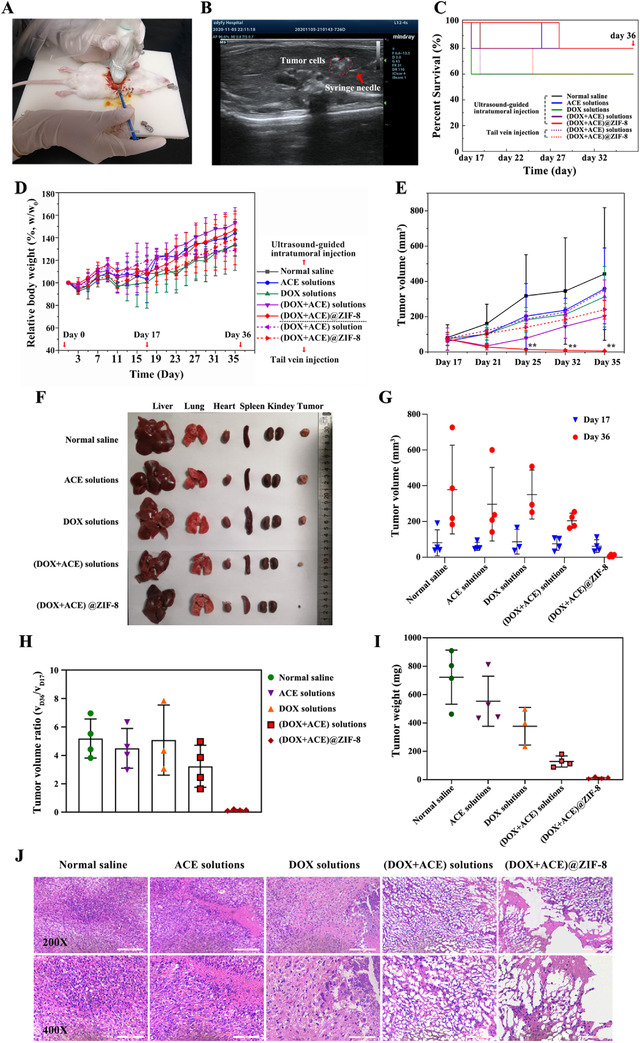
FIGURE 4.

A, Photograph of the percutaneous injection procedure to establish the SD rats bearing hepatic in‐situ tumor models and drug administration under ultrasound guidance. B, Ultrasound imaging of percutaneous intratumoral injection of Walker 256 cells into the liver parenchyma of SD rats. The syringe needle (red arrow) and clusters of tumor cell suspensions (red dash line) in the liver parenchyma of SD rats were clearly observed by ultrasound imaging. C, Survival curves of the rats treated with different formulations. D, Changes in relative bodyweight of the rats during the in vivo experiment. E, Tumor volume of the rats as measured by ultrasound imaging. F, Photograph of tumors and major organs of the tumor‐bearing rats subjected to percutaneous intratumoral injection with different formulations. G, Tumor volume, H, tumor volume ratio, and I, tumor weight measured after SD rat anatomy. J, H&E staining of liver tumors after treatment, (n = 5 in per group). Day 1: animal model establishment; Day 17: treatment with single‐dose of formulations; Day 35: the last ultrasonic examination; Day 36: day of sacrifice. Scale bar, 100 μm. ** P < 0.01
