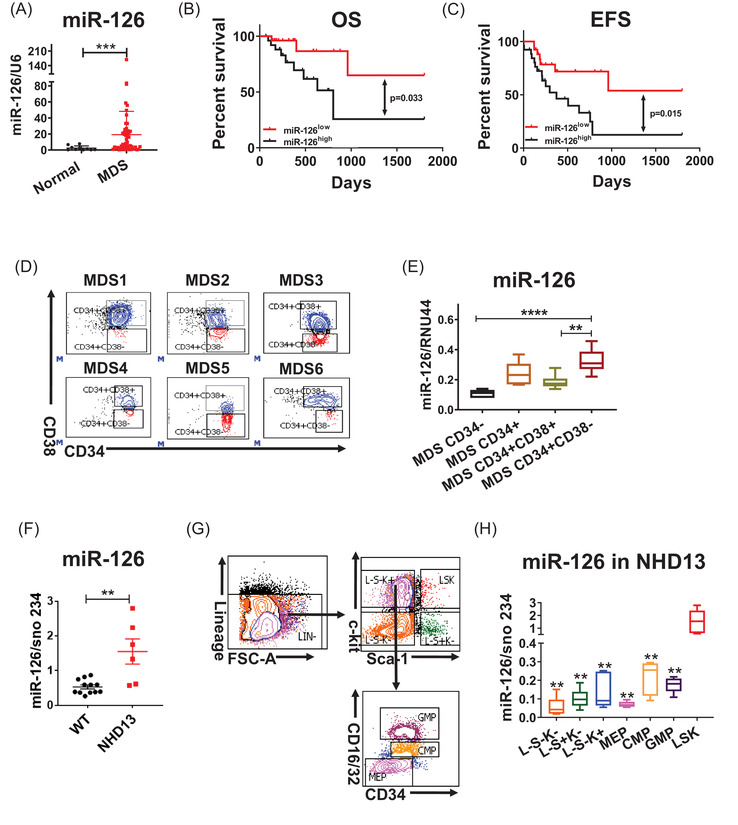
FIGURE 1.

miR‐126 levels increase in MDS HSPCs relative to normal HSPCs. (A) Relative miR‐126 expression in BM mononuclear cells (MNCs) from a cohort of MDS patients (n = 52) and healthy donors (normal; n = 10). (B and C) Overall survival (OS) (B) and event‐free survival (EFS) (C) in MDS patients expressing high and low miR‐126 levels. (F) MiR‐126 expression levels in CD34+ cells from MDS patients and healthy donors. (D and E) Gating strategy for isolation of CD34−, CD34+, CD34+CD38+, and CD34+CD38− subpopulations (D) and relative miR‐126 expression in those subsets from MDS patients (n = 6) (E). F.Relative miR‐126 expression in BM MNCs from a cohort of normal mice and NUP19/HOXD13 (NHD13) mice. G‐H. NHD13 BM cells were first selected using lineage‐negative population enrichment magnetic beads, then cells of subpopulations were sorted by flow cytometry using a FACS Fusion flow cytometer. Gating strategy used to isolate L–S–K–(Lineage–Sca‐1–c‐Kit–), L–S+K–(Lineage–Sca‐1+c‐Kit–), L–S–K+(Lineage–Sca‐1–c‐Kit+), LSK(Lineage–Sca‐1+c‐Kit+), granulocyte/monocyte progenitors (GMP)(Lineage–Sca‐1–c‐Kit+CD34+CD16/32high+), common myeloid progenitors (CMP) (Lineage–Sca‐1–c‐Kit+CD34+CD16/32low+), megakaryocyte erythrocyte progenitors (MEPs) (Lineage–Sca‐1–c‐Kit+CD34–CD16/32–)(G) as well as miR‐126 levels in different populations of NHD13 mice (H).Results shown represent mean ± SEM. **P < 0.01, ***P < 0.001, ****P < 0.0001; by two‐tailed, paired student's t test. The log‐rank test was used to assess significant differences between survival curves
