
FIGURE 2.
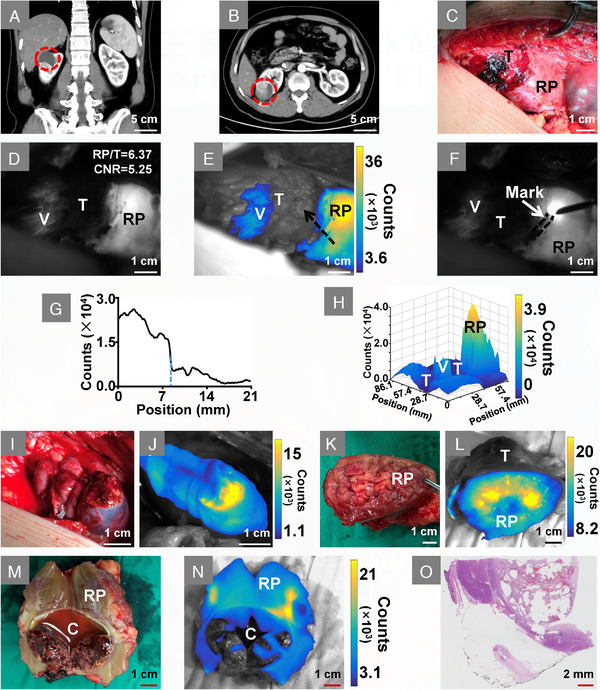
Intraoperative NIR‐II image‐assisted tumour resection. (A and B) Coronal‐plane and transverse‐plane of the enhanced CT image, red circle indicates a renal mass located at the right kidney. (C) Visible‐light image of the tumour and renal parenchyma. (D) Fluorescence is observed in renal parenchyma and partial tumour vessels after ICG injection. (E) Overlay image of D, in which fluorescence is shown in pseudo‐colour. (F) Tumour boundaries were marked by electrocautery on the kidney surface, the black dotted line showed the mark traces. (G) Cross‐sectional fluorescence intensity, which was extracted from the position of the black arrow in E. The blue dotted line in G indicates the place where is the boundary between tumour and renal parenchyma. (H) Three‐dimensional mapping of the fluorescence distribution of D. (I) White‐light illumination image of the surgical margins. (J) NIR‐II imaging shows intense fluorescence on the surgical margin. (K) Visible‐light image of the tumour base. (L) Overlay image shows intense fluorescence on the base of the tumour. (M) Visible‐light image of the tumour cavity, the intact internal fluid indicates the tumour is resected without rupture. (N) Overlay image of the tumour cavity. (O) Pathological examination with haematoxylin and eosin staining shows the tumour is ccRCC. Abbreviations: C, tumour cavity; RP, renal parenchyma; T, tumour; V, vessel