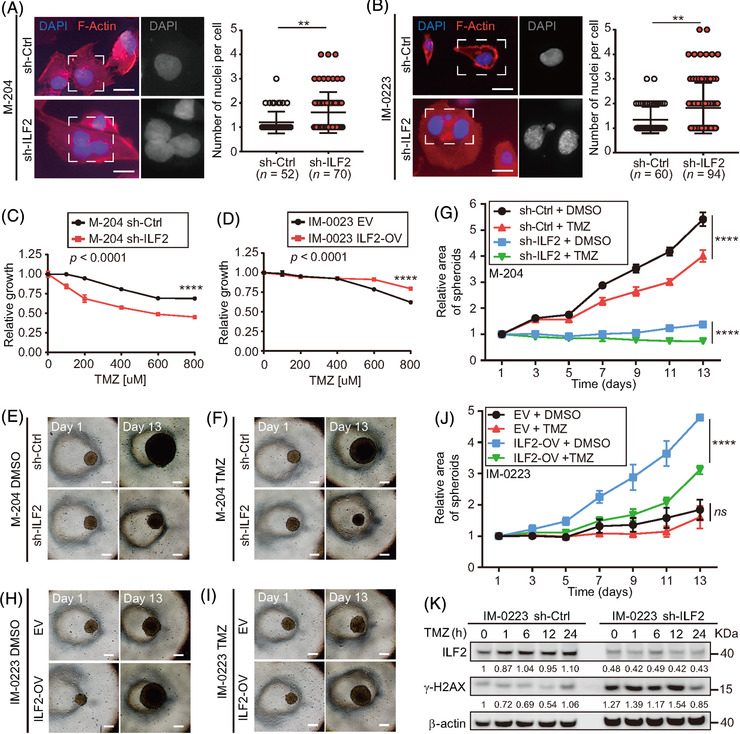
FIGURE 5.

ILF2 controls DNA damage response in metastatic melanoma cell lines. (A and B) Representative images and quantification of the number of nuclei per cell in M‐204 (A) and IM‐0223 (B) cells transduced with the ILF2 shRNA (sh‐ILF2) or non‐silencing shRNA (sh‐Ctrl). The nuclei were stained with DAPI (blue) and F‐actin was stained with Texas‐Red‐X phalloidin (red). Scale bar = 10 μm. (C and D) Drug sensitivity assays for melanoma cell lines with sh‐ILF2 (C) or ILF2‐OV (D) that were treated with different concentrations of TMZ for 3 days and compared to their respective controls. (E–J) Representative images at day 1 and day 13 (E, F, H and I) and quantification of spheroids area (G, J) of melanoma cell lines with ILF2 knockdown (sh‐ILF2) or ILF2 overexpression (ILF2‐OV) treated with 600 μM TMZ for 24 h starting at day 4. Scale bar = 50 μm. (K) Western blot and the quantification of ILF2 and γ‐H2AX in melanoma cells treated with 600 μM TMZ for the indicated time (1, 6, 12 and 24 h). β‐actin was used as the loading sample control. Data represent the mean ± SD. ns: not significant, **p < .01 and ****p < .0001
