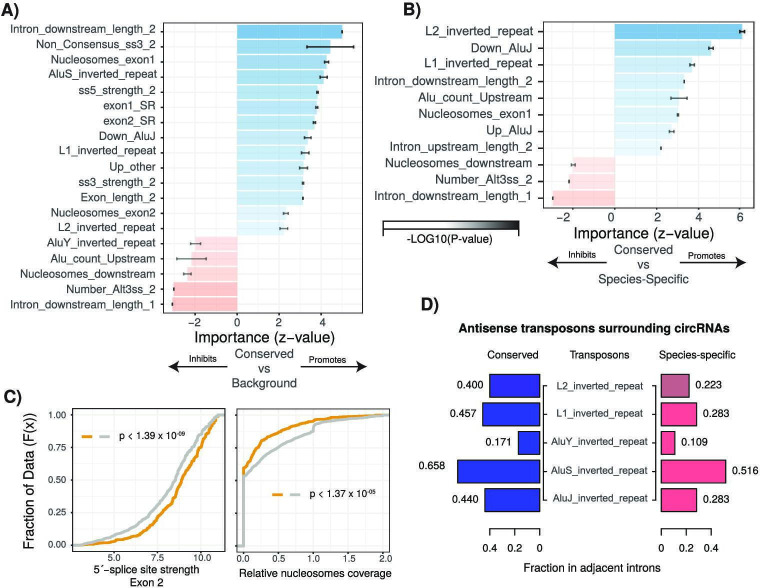
Figure 3. Characterization of cis- and trans-regulatory features of conserved circular RNAs (circRNAs).
(A) Barplot describing feature importance for logistic regression model of conserved circRNAs compared to background. Colors represent positive or negative influence. Transparency reflects log10(p-value of z-statistic). Error bars represent standard error. ‘_1’ is relative to first exon of circRNA and ‘_2’ is relative to final exon of circRNA. ss3: 3´-splice site; ss5: 5´-splice site; Alt3ss: alternative 3´-splice sites. Inverted repeats are repetitive elements on opposite strands in introns adjacent to circRNAs. See Supplementary file 3 for details of features. (B) Barplot describing feature importance for logistic regression model of conserved circRNAs compared to species-specific circRNAs. See (A) for plot interpretation and descriptions. (C) Cumulative distribution plots describing (left; p<1.39 × 10–09) 5´-splice site strength at final exon of circRNAs and (right; p<1.37 × 10–05) distribution of nucleosomes on intron downstream of circRNA. p-Values calculated by Wilcoxon rank-sum test and corrected for multitesting (Bonferroni). See Figure 2D for interpretation of cumulative distribution plot. (D) Pyramid plot showing the mean fraction of circRNAs with selected inverted repeat retrotransposon elements in adjacent introns.


