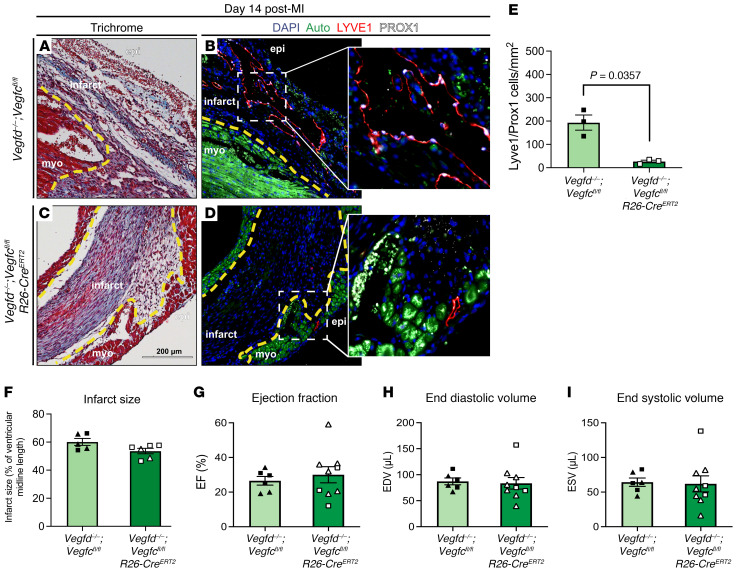
Figure 3. Deletion of the lymphangiogenic VEGF-C and VEGF-D ligands decreases lymphatic expansion after MI but does not decrease cardiac function.
(A and B) Adjacent sections from the same infarct zone in a Vegfd–/–; Vegfcfl/fl animal 14 days after MI were examined using Masson’s trichrome stain (A) and immunostained for the lymphatic endothelial markers LYVE1 and PROX1 (B). The inset in B shows the boxed region at higher magnification. (C and D) Adjacent sections from the same infarct zone in a Vegfd–/–; Vegfcfl/fl; R26-CreERT2 heart 14 days after MI were examined using Masson’s trichrome stain (C) and immunostained for the lymphatic endothelial markers LYVE1 and PROX1 (D). The inset in D shows the boxed region at higher magnification. (E) The number of LYVE1+PROX1+ lymphatic endothelial cells was measured per mm2 in the infarct zone of the indicated animals (n = 3, 3). (F) The infarct size 14 days after MI was determined histologically (n = 5, 6). (G–I) The cardiac functional parameters ejection fraction (G), end diastolic volume (H), and end systolic volume (I) were measured 14 days after MI in the indicated animals in a fully blinded manner (n = 6, 9). In A–D, a dashed yellow line denotes the infarct border, “epi” denotes epicardial surface of the heart, “myo” denotes live myocardium, and “infarct” denotes infarct zone. Triangles represent female animals in F–I. Bar graphs represent mean ± SEM. Statistical comparisons were made with a 2-tailed t test.

