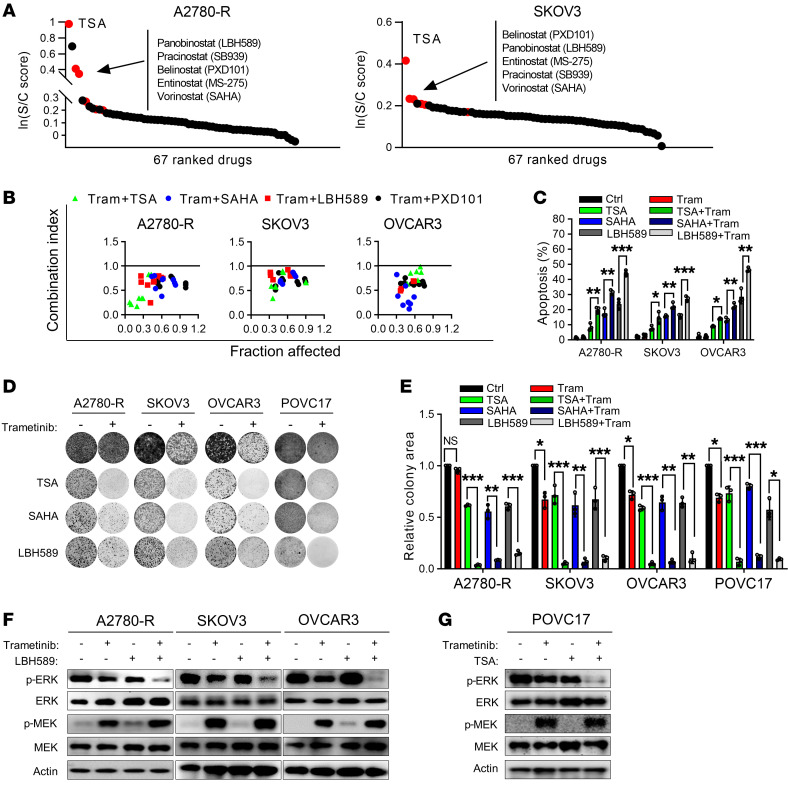
Figure 4. Combination drug screen identifies HDAC inhibitors as sensitizers to trametinib in resistant cells.
(A) Graph showing the results of a drug screen performed in A2780-R and SKOV3 triplicates with 67 compounds either singly or in combination with 0.5 μM trametinib. Data represent the mean of 3 biological replicates. Sixty-seven drugs on-screen are ranked according to the S/C (single/combination) score. Arrows highlight HDAC inhibitors (red). (B) Combination index of MEK and HDAC inhibitors in trametinib-resistant cell lines. Data represent the mean of 3 biological replicates. Combination index greater than 1 was defined as antagonism; combination index less than 1 was defined as synergy. (C) Apoptosis induced by combination of trametinib and HDACi in resistant cell lines. Cell lines were treated as indicated for 72 hours, after which annexin V/propidium iodide staining was performed, followed by flow cytometry. (D and E) Representative images (D) and quantification (E) of colony formation assay in resistant cells treated with vehicle, trametinib, HDACi, or their combination. (F) Immunoblot analysis of ERK and MEK activity in A2780-R, SKOV3, and OVCAR3 cells treated with vehicle, 100 nM trametinib, 25 nM LBH589, or their combination for 72 hours. (G) Immunoblot analysis of ERK and MEK activity in POVC17 cells treated with vehicle, 100 nM trametinib, 50 nM TSA, or their combination for 72 hours. (C and E) Results are represented as mean ± SD of 3 independent experiments. *P < 0.05, **P < 0.01, ***P < 0.001 by 1-way ANOVA with Bonferroni’s post hoc test.

