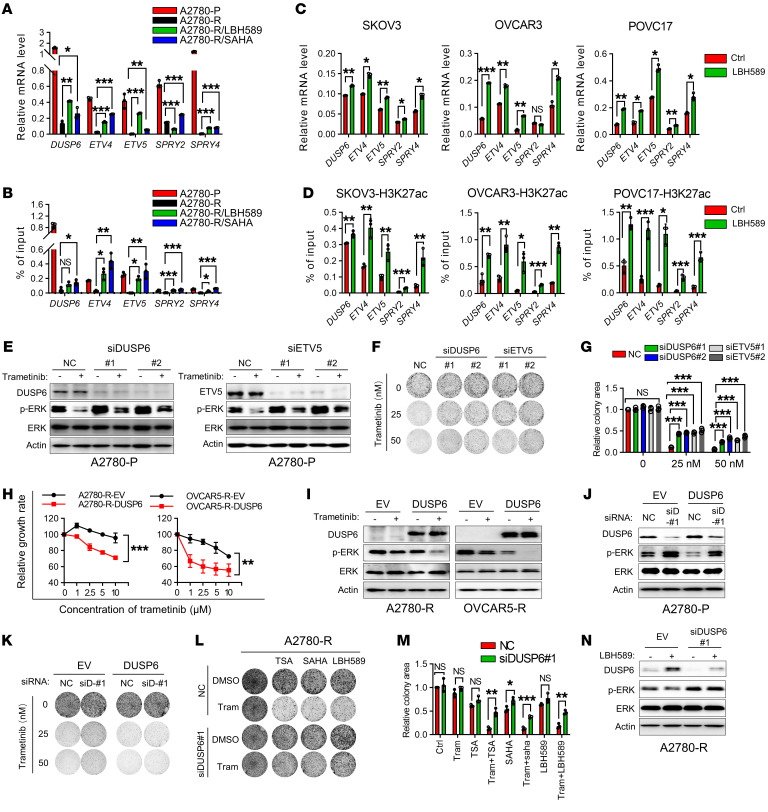
Figure 5. HDAC inhibitors reactivate repressive enhancers to block MAPK signaling restoration in trametinib-resistant cells.
(A and B) qRT-PCR (A) and ChIP-qPCR analysis of H3K27ac binding (B) of MAPK negative regulators in A2780-P and A2780-R cells treated with vehicle, SAHA, or LBH589. (C and D) qRT-PCR (C) and ChIP-qPCR analysis of H3K27ac binding (D) of MAPK negative regulators in resistant cells treated with vehicle or LBH589. (E) Immunoblot analysis of indicated proteins in A2780-P cells treated with trametinib after transfection with either negative control (NC), siDUSP6, or siETV5. (F and G) Representative images (F) and quantification (G) of colony formation assay in A2780-P cells treated with trametinib after transfection with siRNA described in E. (H) Cell viability assay of the effect of DUSP6 re-expression in A2780-R or OVCAR5-R cells on trametinib sensitivity. (I) Immunoblot analysis of indicated proteins in A2780-R or OVCAR5-R cells with DUSP6 re-expression, treated with vehicle or trametinib. (J and K) Immunoblot analysis of indicated proteins (J) and representative images (K) of colony formation assay in A2780-P cells treated with either siNC or siDUSP6 #1 (targeting untranslated region) after stable expression of empty vector (EV) or DUSP6. (L and M) Representative images (L) and quantification (M) of colony formation assay in A2780-R cells treated with trametinib with or without HDACi after transfection with either siNC or siDUSP6. (N) Immunoblot analysis of indicated proteins in A2780-R cells treated with vehicle or LBH589 after transfection with siRNA described in L. (F, K, and L) Images are representative of 3 independent experiments. (A–D, G, H, and M) Data are mean ± SD of 3 independent experiments. (A, B, and G) One-way ANOVA with Bonferroni’s post hoc test; (C, D, and M) unpaired Student’s t test; (H) 2-way ANOVA with Tukey’s post hoc test. *P < 0.05, **P < 0.01, ***P < 0.001.

