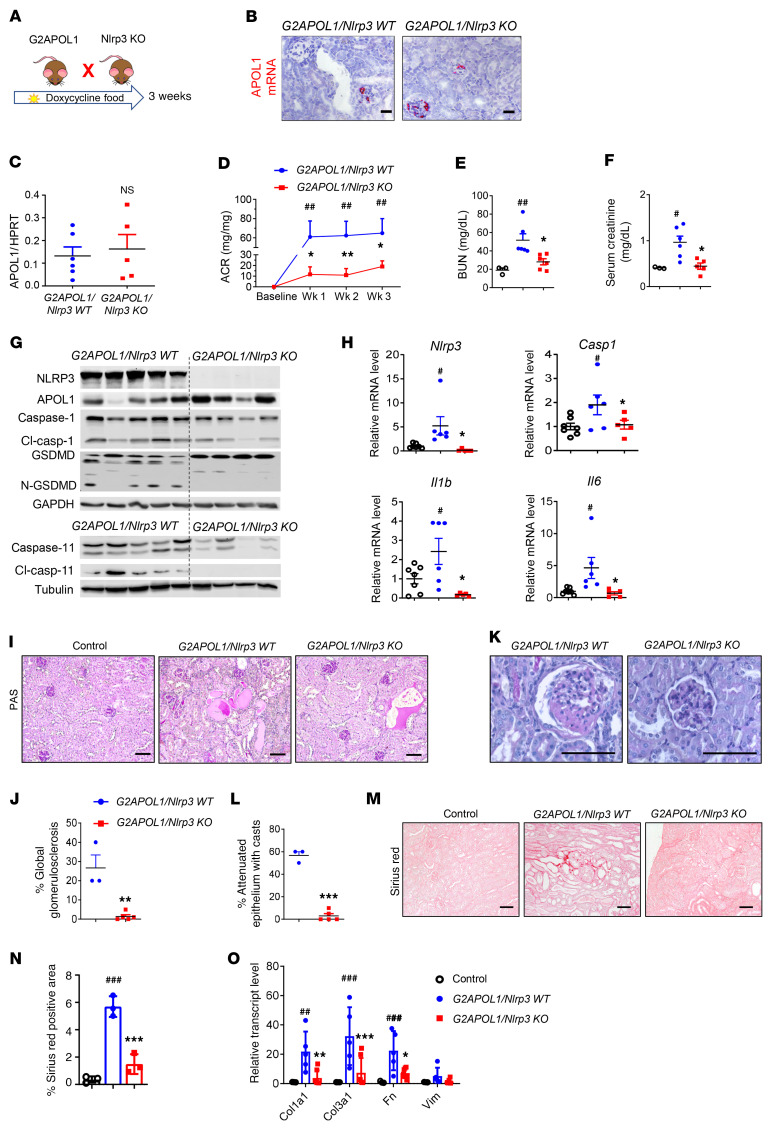
Figure 4. Genetic deletion of Nlrp3 in G2APOL1-transgenic mice markedly improves kidney function.
(A) Experimental design for the generation of G2APOL1/Nlpr3-KO mice. (B) Representative images of APOL1 in situ hybridization. (C) Relative APOL1 transcript levels in kidneys of G2APOL1/Nlrp3-WT (n = 6) and G2APOL1/Nlrp3-KO (n = 5) mice. (D) ACR of G2APOL1/Nlpr3-KO (n = 6) and G2APOL1/Nlrp3-KO mice (n = 5) at baseline, 1, 2, and 3 weeks on doxycycline diet. ##P < 0.01 vs. baseline; *P < 0.05, **P < 0.01 vs. G2APOL1/Nlrp3-KO mice at the same time points. (E) BUN and (F) serum creatinine levels of control (n = 3), G2APOL1/Nlrp3-WT (n = 6), and G2APOL1/Nlrp3-KO mice (n = 5). *P < 0.05 vs. G2APOL1/Nlrp3-WT; #P < 0.05, ##P < 0.01 vs. control. (G) Western blots of whole-kidney lysates. (H) Relative transcript levels of Nlrp3, Casp1, Il1b, and Il6 in control (n = 7), G2APOL1/ Nlrp3-WT (n = 6), and G2APOL1/Nlrp3-KO (n = 5) mice. #P < 0.05 vs. control; *P < 0.05 vs. G2APOL1/Nlrp3-WT. (I) PAS-stained kidney sections. (J) Semiquantitative analysis of percentage of globally sclerotic glomeruli in G2APOL1/Nlrp3-WT (n = 3) and G2APOL1/NLRP3-KO (n = 5) mice. **P < 0.01 vs. G2APOL1/NLRP3-WT. (K) Representative images of glomeruli. (L) Percentage of attenuated epithelium with casts in G2APOL1/Nlrp3-WT (n = 3) and G2APOL1/NLRP3-KO (n = 5) mice. ***P < 0.001 vs. G2APOL1/NLRP3-WT. (M) Sirius red–stained kidney sections. (N) Quantification of Sirius red–positive area. ###P < 0.001 vs. control; ***P < 0.001 vs. G2APOL1/NLRP3-WT. (O) Relative mRNA levels of Col1a1, Col3a1, Fn1, and Vim in the kidneys of control (n = 3), G2APOL1/NLRP3-WT (n = 5), and G2APOL1/NLRP3-KO (n = 7) mice. ##P < 0.01, ###P < 0.001 vs. control; **P < 0.01, ***P < 0.001 vs. G2APOL1/NLRP3-WT. Scale bars: 30 μm. Significance was determined by 1-way ANOVA and SNK post hoc test. Data are expressed as the mean ± SEM.

