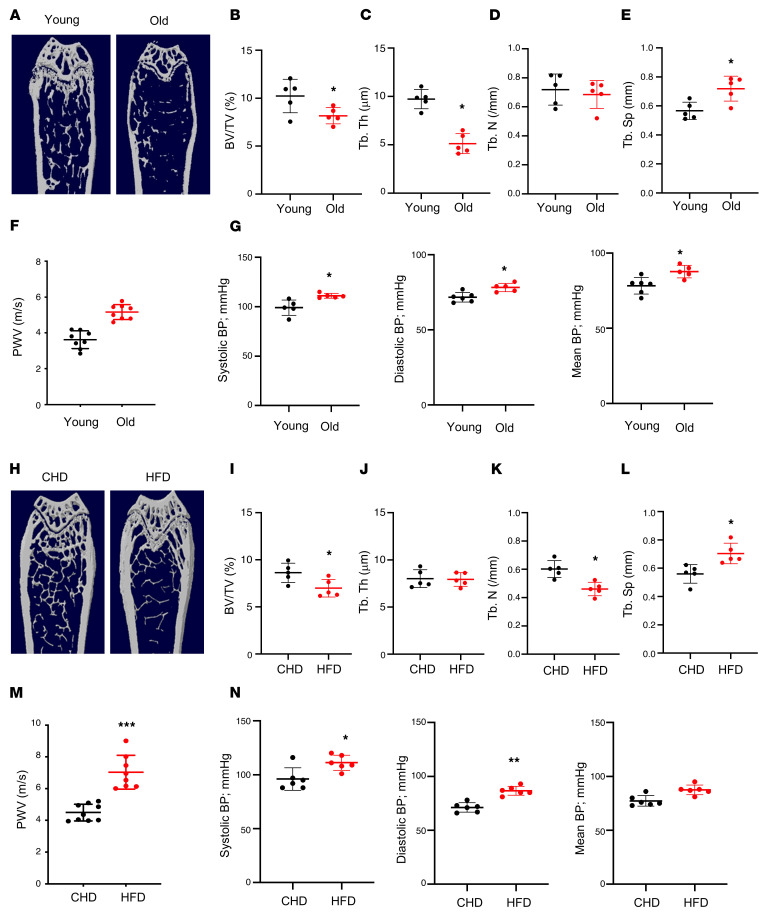
Figure 1. Aged mice and HFD-challenged mice develop low bone mass and an arterial stiffening phenotype.
(A–E) Representative μCT images (A) and quantitative analysis (B–E) of the trabecular bone area of the distal femur from 4- and 20-month-old male C57BL/6 mice. Bone volume per tissue volume (BV/TV) (B), trabecular bone thickness (Tb.Th) (C), trabecular bone number (Tb.N) (D), and trabecular bone separation (Tb.Sp) (E). (F and G) Pulse-wave velocity (PWV) and systolic, diastolic, and mean blood pressure (BP) measurements of 4- and 20-month-old male mice. (H–L) Representative μCT images (H) and quantitative analysis (I–L) of the trabecular bone area of the distal femur from 3-month-old male C57BL/6 mice fed a Western HFD or normal CHD for 5 months. BV/TV (I), Tb.Th (J), Tb.N (K), and Tb.Sp (L). (M and N) PWV and BP measurements of the mice fed HFD or CHD. n = 5 to 9. Data are mean ± SD, *P < 0.05, *P < 0.01, ***P < 0.005, as determined by Student’s t tests.

