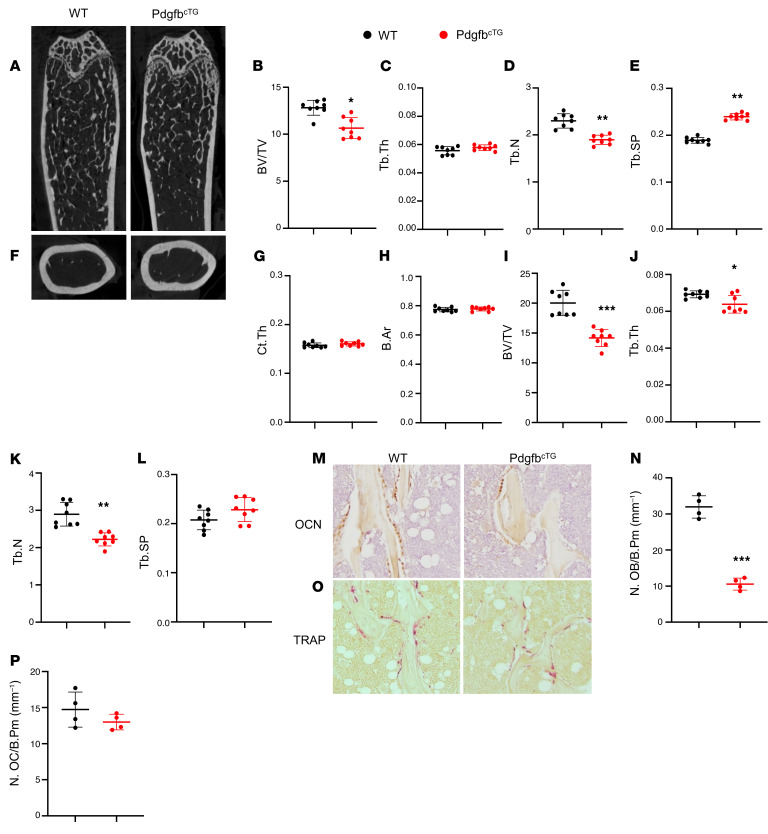
Figure 6. Conditional Pdgfb transgenic mice recapitulate an aging-associated bone phenotype.
(A–E) Representative μCT images (A) and quantitative analyses (B–E) of the trabecular bone area of the distal femur from male 6-month-old PdgfbcTG mice and WT littermates. BV/TV (B), Tb.Th (C), Tb.N (D), and Tb.Sp (E). Representative μCT images (F) and quantitative analysis (G and H) of the cross-sections of femoral mid-diaphysis of mice. Ct.Th, cortical bone thickness; B. Ar, bone area. (I–L) Quantitative μCT analyses of the trabecular bone area of the distal femur from female 9-month-old PdgfbcTG mice and WT littermates. BV/TV (I), Tb.Th (J), Tb.N (K), and Tb.Sp (L). (M and N) Representative immunohistochemical staining (M) and quantitative analysis of osteocalcin (OCN) (N) in femur sections. (O and P) Representative TRAP staining (O) and quantitative analysis of TRAP+ cells in femur sections (P). N.OB/B.Pm, number of osteocalcin+ osteoblasts per bone perimeter; N.OC/B.Pm, number of TRAP+ osteoclasts per bone perimeter. *P < 0.05, **P < 0.01, ***P < 0.001 as determined by Student’s t tests.

