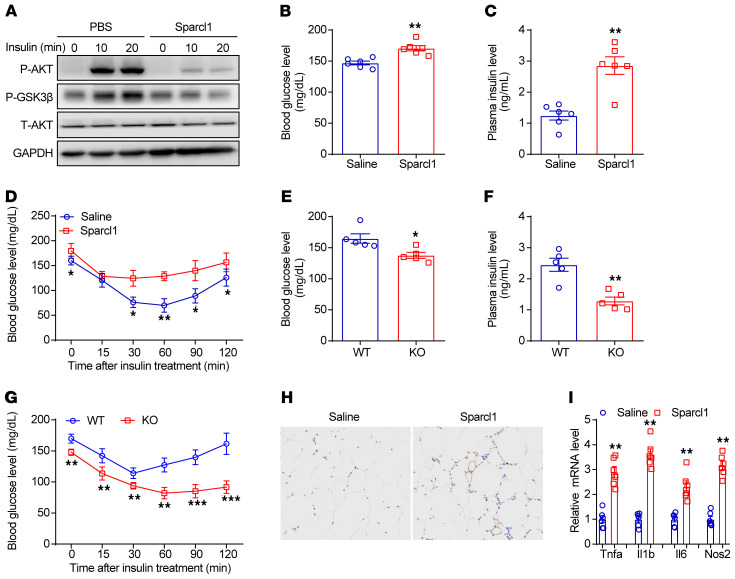
Figure 9. Sparcl1 disrupts systemic glucose metabolism in NASH mice.
(A) Western blots showing the insulin-stimulated phosphorylated AKT (P-AKT) and GSK3β (P-GSK3β) in Hepa1-6 cells treated with Sparcl1 (100 ng/mL) or vehicle control (PBS). Cells were preincubated with palmitate (0.2 mM) for 12 hours. (B–D) Blood glucose levels (B), plasma insulin levels (C), and insulin tolerance test (D) in HFHC diet–fed mice with chronic treatment of Sparcl1 or saline. n = 6 per group. (E–G) Blood glucose levels (E), plasma insulin levels (F), and insulin tolerance test (G) in Sparcl1-WT and -KO mice fed an HFHC diet for 28 weeks. n = 5 per group. (H) F4/80 crown-like structures in the iWAT sections from HFHC diet–fed mice after chronic treatment with Sparcl1 or saline. (I) Relative mRNA levels of proinflammatory cytokines. n = 6 per group. Data are represented as mean ± SEM. *P < 0.05, **P < 0.01, ***P < 0.001 by 2-tailed Student’s t test (B, C, E, F, and I) or 1-way ANOVA (D and G). Original magnification, ×200 (H).

