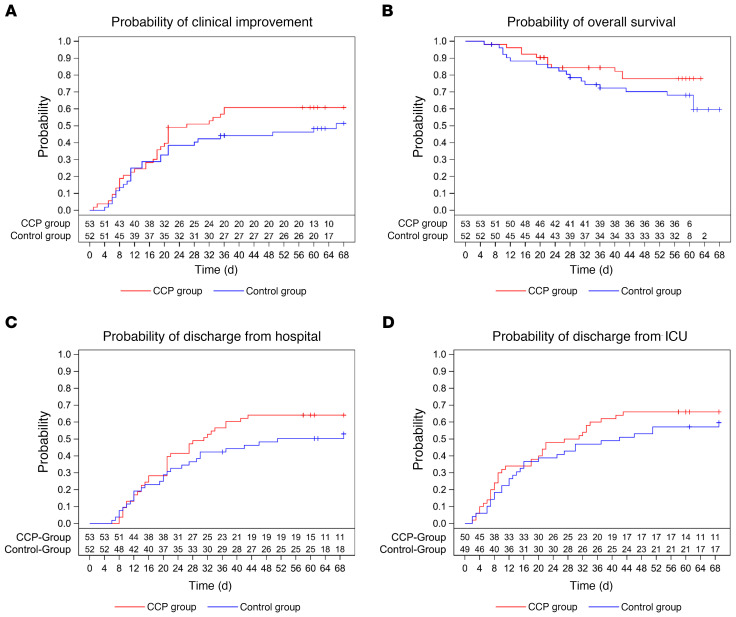
Figure 2. Occurrence of secondary outcomes.
Kaplan-Meier cumulative estimates of probability are shown. (A) The key secondary outcome time to clinical improvement compared in the CCP group (red line) and control group (blue line). Censored patients are indicated by “+”. P = 0.27 (log-rank test). (B) Probability of overall survival compared in the CCP group (red line) and control group (blue line). Censored patients are indicated by “+”. P = 0.21 (log-rank test). (C) Probability of discharge from hospital compared in the CCP group (red line) and control group (blue line). Censored patients are indicated by “+”. P = 0.24 (log-rank test). (D) Probability of discharge from ICU compared in the CCP group (red line) and control group (blue line). Censored patients are indicated by “+”. P = 0.39 (log-rank test).

