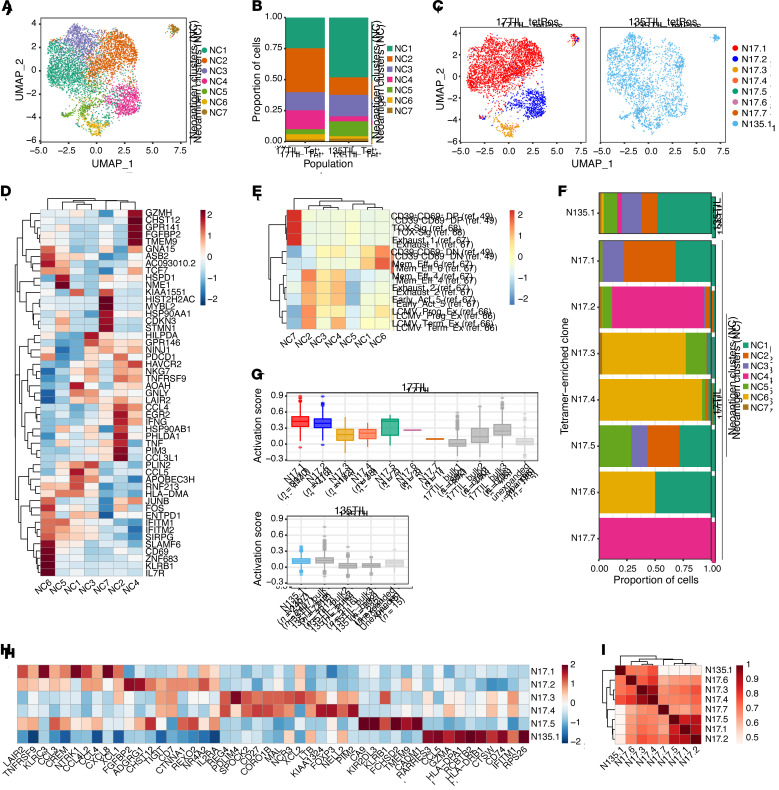
Figure 10. Contrasting tetramer-specific clones reveals transcriptional clonal segregation.
(A) UMAP of cells from tetramer+ populations colored by phenotype cluster. (B) Distribution of cells across clusters within each patient sample. Tet+, tetramer+. (C) UMAP of cells from each patient sample colored by tetramer-enriched clone identity. tetPos, tetramer+. (D) Heatmap depicting gene expression of select cluster markers and canonical T cell subset marker genes across the phenotypic clusters identified. (E) Gene expression module scoring of tetramer+ clusters with previously published CD8+ T cell gene sets (select signatures from ref. 49 and refs. 66–68). (F) Distribution of cells across phenotype clusters within each tetramer-enriched clone. (G) Comparison of T cell activation scores (from ref. 50) between each tetramer-enriched clone, other highly expanded clones in the bulk population, and all other unexpanded clones. The number of cells in each clone or group is indicated. (H) Gene signatures of each tetramer-enriched clone (for clones with >5 cells). (I) Spearman correlation of tetramer-enriched clones based on clone-specific gene signatures as defined in H.

