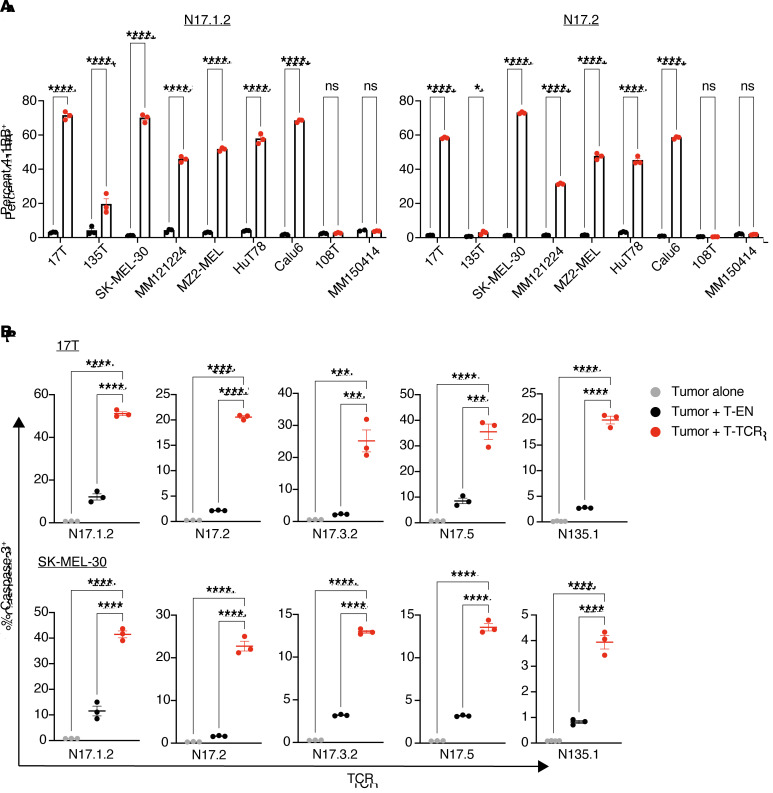
Figure 7. Neoantigen-specific TCRs convey reactivity and cytotoxic capacity toward tumor cells that endogenously express the neoantigen.
Healthy donor T cells were electroporated with in vitro–transcribed TCR α and β chains and coincubated with tumor-derived cell lines. Donor cells electroporated without mRNA were used as T cell negative controls. (A) Percentage of T cells expressing the activation marker 4-1BB after an overnight 1:1 coincubation; 17T, 135T, SK-MEL-30, MM121224 and MZ2-MEL are all melanoma cell lines endogenously expressing HLA-A*01:01/NRAS.Q61K. HuT78 is a T cell lymphoma cell line that endogenously expresses HLA-A*01:01/NRAS.Q61K. Calu6 is a lung adenocarcinoma cell line that endogenously expresses HLA-A*01:01/KRAS.Q61K. Negative control cell lines: 108T (A*01:01+/NRAS WT); MM150414 (A*01:01–/NRAS.Q61K). See Methods for further information on the cell lines. *P < 0.05 and ****P < 0.0001, by 2-way ANOVA with Sidak’s correction for multiple comparisons. (B) Cleaved caspase-3 killing assay: percentage of 17T (top) and SK-MEL-30 (bottom) tumor cells expressing cleaved caspase-3 after a 3-hour coincubation at a 3:1 effector/target ratio. ***P < 0.001 and ****P < 0.0001, by 1-way ANOVA with Tukey’s correction for multiple comparisons. Error bars represent the SEM of biological triplicates throughout.

