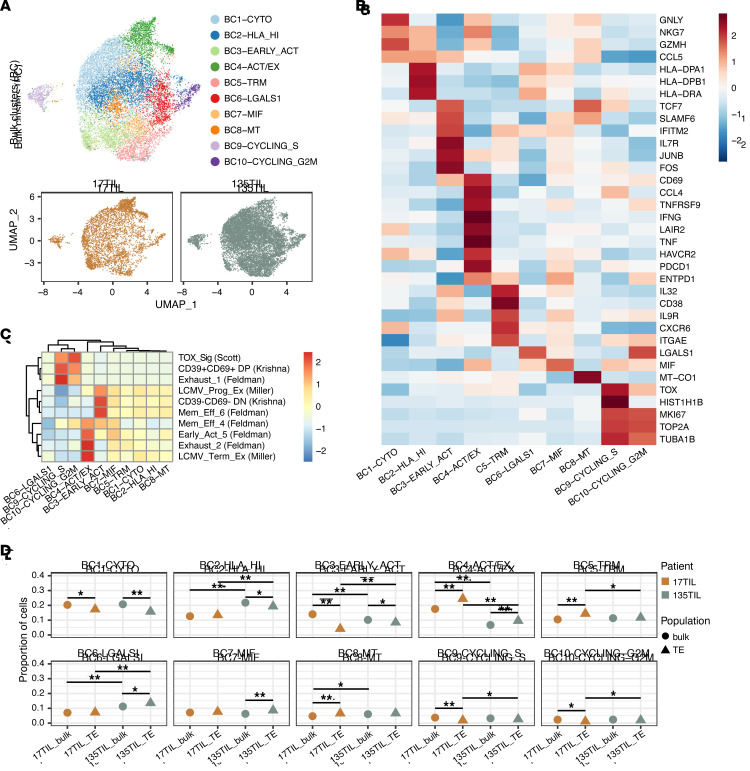
Figure 9. Unsupervised clustering of bulk TILs.
Tetramer-enriched clones showed increased exhaustion and decreased early-activation proportions compared with bulk TILs. (A) UMAP of cells from bulk-sorted populations colored by phenotype cluster (top). UMAP of cells from each patient sample (bottom). (B) Heatmap depicting gene expression of select cluster markers and canonical T cell subset marker genes across the phenotypic clusters identified. (C) Gene expression module scoring of clusters with previously published CD8+ T cell gene sets (select signatures from ref. 43). (D) Comparison of phenotypic proportions among 17TIL and 135TIL bulk and tetramer+ populations. *P < 0.05 and **P < 0.001, by χ2 test.

