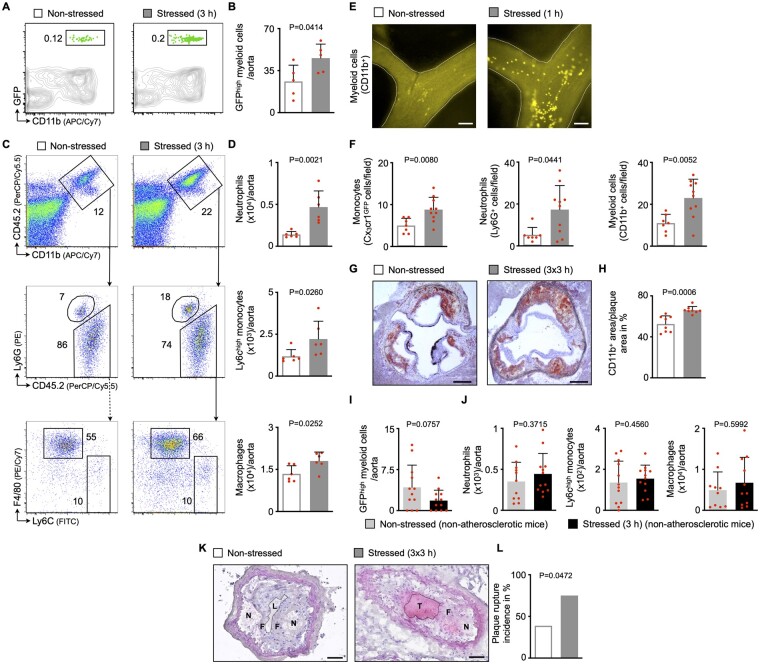
Figure 2.
Acute mental stress exposure aggravates inflammatory blood leucocyte migration into atherosclerotic plaques. (A, B) Gating and quantification of GFPhigh myeloid cells in atherosclerotic aortas after adoptive transfer of GFPhigh monocytes and neutrophils into non-stressed vs. stressed ApoE−/− mice (21 h after a single 3 h episode of restraint stress, n = 5 per group, Student’s t-test). (C, D) Gating and quantification of aortic myeloid cells from non-stressed vs. stressed ApoE−/− mice (n = 6 per group, Mann–Whitney U-test for Ly6Chigh monocytes, Student’s t-test for neutrophils and macrophages). (E, F) Representative images (myeloid cells, CD11bhigh) and quantification of adherent myeloid cells in non-stressed vs. stressed ApoE−/− mice using intravital microscopy on carotid arteries (immediately after a single 1 h episode of restraint stress, n = 7–10 per group, Student’s t-test, Mann–Whitney U-test for neutrophils). Scale bars represent 100 µm. (G, H) Representative immunohistochemical staining of aortic roots from non-stressed vs. stressed ApoE−/− mice (after three episodes of 3 h restraint stress once daily) for myeloid cells (CD11b). Scale bars represent 200 µm. Bar graphs show the percentage of positive area per plaque area (n = 8 per group, Student’s t-test). (I) Quantification of GFPhigh myeloid cells in aortas after adoptive transfer of GFPhigh monocytes and neutrophils into non-stressed vs. stressed non-atherosclerotic wild-type mice (21 h after a single 3 h episode of restraint stress, n = 12 per group, Mann–Whitney U-test). (J) Quantification of aortic myeloid cells from non-stressed vs. stressed non-atherosclerotic wild-type mice (n = 10–12 per group, Student’s t-test). (K, L) Representative images and quantification of plaque rupture in carotid arteries from non-stressed vs. stressed ApoE−/− mice (after three episodes of 3 h restraint stress once daily; N, necrotic core; F, fibrous cap; L, arterial lumen; T, thrombus). Thrombus formation is considered an indicator for plaque rupture. Scale bars represent 50 µm. Bar graphs show the incidence of plaque rupture (n = 18–20 per group, Fisher’s exact test). Numbers next to gates indicate frequencies (%). Data are presented as mean ± SD.

