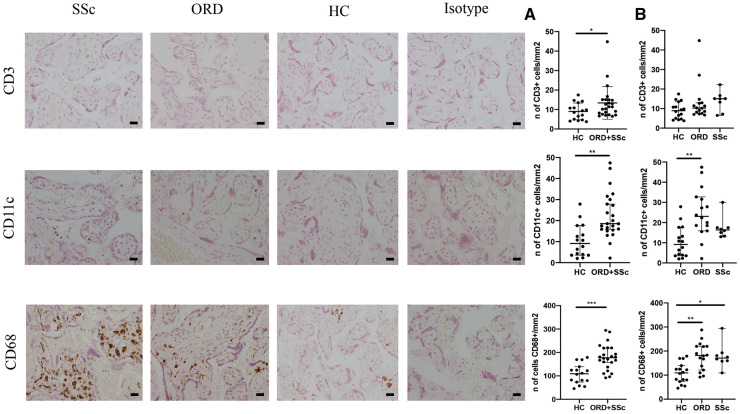
Fig. 1.
Immunohistochemical analysis
(A) CD3, CD11c and CD68 expression in placentas from patients with SSc, other rheumatic diseases (ORD) and healthy controls (HC). Scale bar: 20 μm. (B) Median and 95% CI of CD3+, CD11c+ and CD68+ cell expression per mm2 in HC compared with rheumatic disease patients (ORD+SSc). (C) Median and 95% CI of CD3+, CD11c+ and CD68+ cell expression per mm2 of HC, ORD and SSc groups. *P <0.05, **P <0.001, ***P <0.0001

