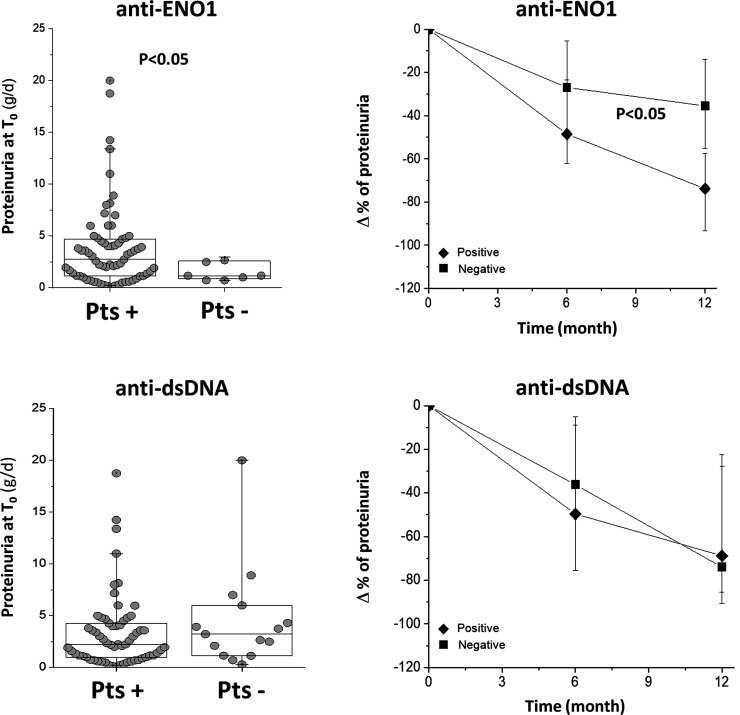
Fig. 5 Proteinuria at T0 and modifications during the follow-up in anti-ENO1 positive and negative LN patients
Proteinuria at T0 and % changes during the first 12 months of follow-up are reported for patients positive and negative for anti-ENO1. In the former case (proteinuria levels) a statistical difference was observed between the two groups. Also, the decrement of proteinuria was more evident in anti-ENO1 positive patients. The same parameters are reported sub-dividing the whole LN group in respect to positivity for anti-dsDNA IgG2.

