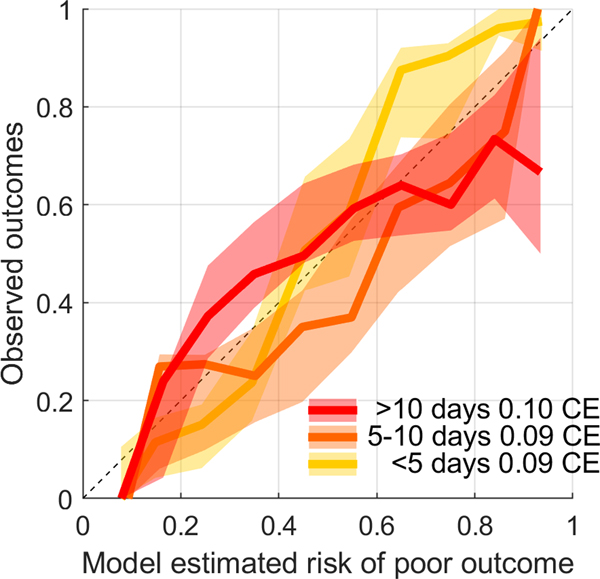
Figure 5. Modeled performance: Calibration curves.
Model calibration curves across the three strata of time intervals between measurement of peak EA and discharge are shown. The mean calibration errors for the multivariable outcome model across the three strata were as follows: 1) < 5 days between last EEG measurement and discharge: 0.0941 [CI 0.0706, 0.1191); 5–10 days between last EEG measurement and discharge: 0.0946 [ CI 0.0631, 0.1290]; > 10 days between last EEG measurement and discharge: 0.0998 [CI 0.0698, 0.1335].

