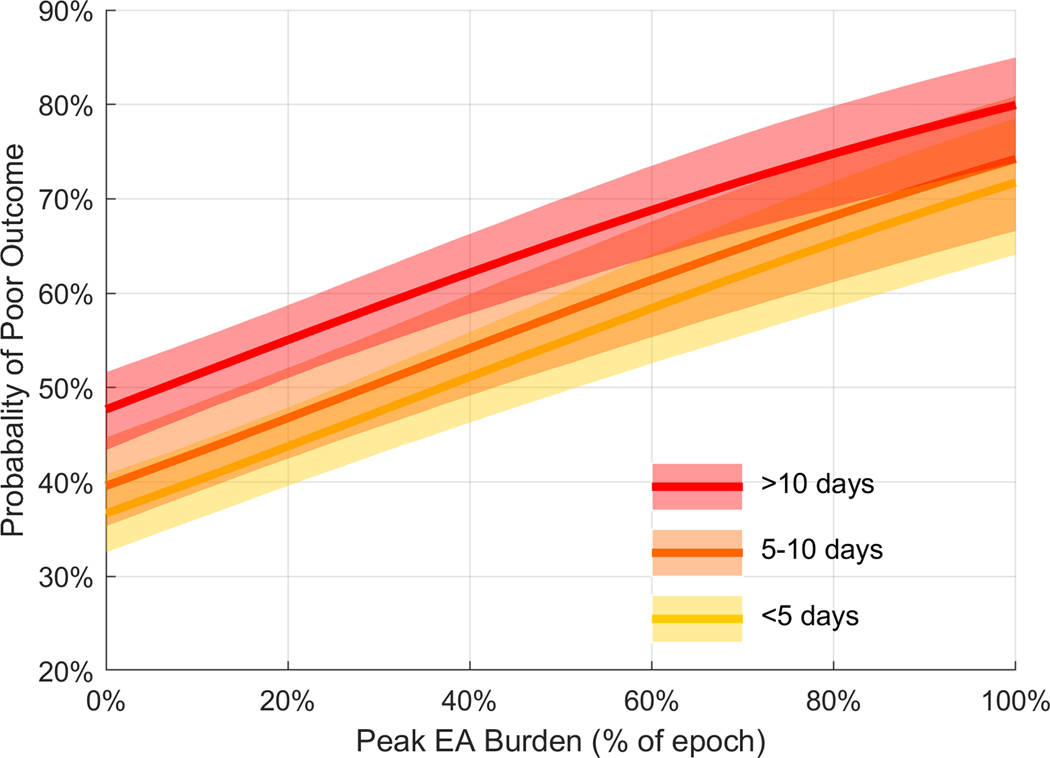
Figure 6. Dose-response relation between peak epileptiform activity burden and outcomes.
The figure shows the modeled probability of poor outcome (mRS 5–6) with increasing peak burden (maximum EA burden captured within any 12-hour window). This dose-response plot is obtained from the multivariable model that included the final 9 covariates: Age, initial GCS, worst GCS in the first 24 hours, APACHE II score, history of epilepsy, seizure on presentation, primary diagnosis of HIE, primary diagnosis of acute seizure/SE, peak burden. The shaded area represents the 95% confidence intervals of the model output. Increasing the peak EA burden from 0 to 100% increases the probability of a poor outcome by approximately 35% across all strata. The median value of other covariates is used to build the curve.
ABI: acute brain injury; GCS: Glasgow Coma Scale score; EA: epileptiform activity; HIE: hypoxic ischemic encephalopathy; SZ/SE: acute seizure/status epilepticus

