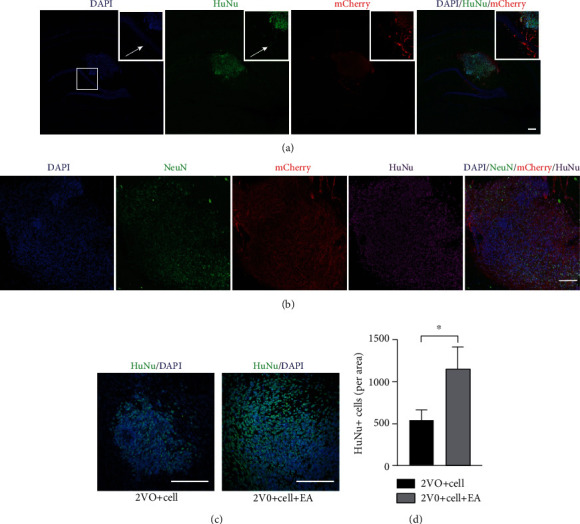
Figure 7.

Effect of EA treatment on the survival of the grafted MGE neural progenitors in the hippocampus. (a) Fluorescence photomicrographs of HuNu+/mCherry+-positive cells from the 2VO+Cell+EA group. Scale bar = 200 μm. (b) Some HuNu+/mCherry+-positive cells from the 2VO+Cell+EA group weakly expressed NeuN. Scale bar = 100 μm. (c) Fluorescence photomicrographs of HuNu+-positive cells from the 2VO+Cell and 2VO+Cell+EA groups. Scale bar = 100 μm. (d) Quantification of HuNu+-positive cells in the 2VO+Cell and 2VO+Cell+EA groups. Values are mean ± SEM (N = 5 rats/per group). ∗P < 0.05.
